Board design is an attractive career option; it’s time to pass industry knowledge to the next generation.
The 2016 printed circuit board design community looks much like it did in 2015. No drastic changes have occurred in the past 12 months, but they are ever-looming. Like last year, veteran designers are the majority and salaries are on the rise, based on recent survey results. Designers are diligent and producing a significant number of designs each year. With more than a third of designers having 30-plus years of experience in the industry, and with more than 60% older than 50, how much longer can this picture hold out? It’s logical to predict a plethora of retirement parties coming soon. What will the survey numbers look like five to 10 years from now, when former designers are relaxing by the pool?
With well over half the community pulling in more than $80,000 annually, according to 2016 numbers, the world of PCB design is an appealing career path; this year, designers said so themselves, noting their overall happiness with their current positions. It’s the experts’ task to make that known to the youth of today, male and female alike, providing them with opportunities to learn the ropes. It very well may be engineering’s best kept secret; it’s time to spread the word, as Jennifer Waskow from Rockwell Collins urged based on last year’s survey results.
From mid-May to mid-June, PCD&F conducted a global survey of bare board designers, managers, and design engineers, receiving 443 responses. Data compiled included salaries, job functions, titles, project types and quantity, benefits, education, years of experience, challenges, locations, ages, the number of and location where designers are being hired, and end-markets, to name some. While year-over-year changes are shown, they are for comparisons only, and should not be assumed to be definitive.
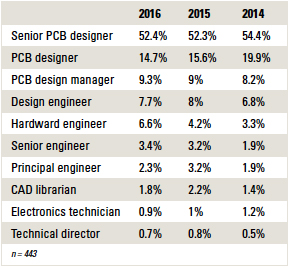
Of the 443 respondents, 67% said they are PCB designers, including the “senior” designation, down from 68% in 2015. The number of engineers who completed the
survey this year rose to more than 21%, up from nearly 19% in 2015. PCB design managers, electronics technicians, CAD librarians, and technical directors who completed the survey remained relatively flat with last year (TABLE 1).
Table 1. Respondents by Job Title
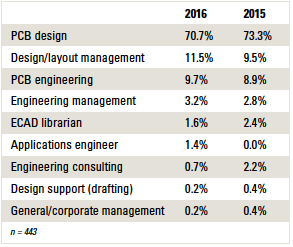
The percentage of designers who said their principal job function is PCB design, including schematic, layout, placement, etc., was 71%, compared to 73% last year, while engineering-related careers increased to 10% from 9%. The number of designers indicating their principal function is design/layout management was 11.5%, up from 9.5% in 2015. Engineering management was up slightly, while engineering consulting and ECAD librarian were both down by a small margin (TABLE 2).
Table 2. Principal Job Functions
Respondents were overwhelmingly employed by OEMs. More than 73% reported working for OEMs in this year’s survey, up from 71.7% last year. Those who said they work for either a design service bureau or both an OEM and design service bureau was 18%, while 3.5% work for an EMS/contract assembler or PCB fabricator. Some 5% of respondents were primarily consultants, in academia or instructors.
Veteran designers in the field continue to steadily grow. Designers who have more than 30 years of experience account for nearly 35% of those who responded to this year’s survey, up from 33% in 2015 and 28% in 2014. In comparison, only 4% said they have 1 to 5 years of experience, down from more than 7% last year and 12% in 2014. Those who said they have 16 to 20 years of experience rose to 16%, up from 13% last year. All other brackets in this category remained nearly flat. If the results are any indication, the industry must continue to promote PCB design-related education to encourage more applicants to enter the workforce – and soon.
The majority of designers who took this year’s survey are over 50 (60.5%), compared to 59% last year. A marked change occurred in the 61 to 70 age range, accounting for 14.2%, up from more than 11% in 2015. The 41 to 50 age range remained flat, as did designers who are under 40; within that bracket, however, designers who said they are 36 to 40 rose from 5.6% to 7.5%, while the 31 to 35 category dropped slightly from 6.8% to 5%.
Women constituted 12% of survey responders, up one percentage point from last year.
While still the majority, those who weighed in from North America accounted for 81% of respondents, down from 86% in 2015 (FIGURE 1). Designers who took the survey in the US decreased to 76% from 80%, and European residents increased to 11%, up from 7.6%. Only 4% of responses came from India, while 0.2% came from China, slightly down from last year. No one from Japan, Africa, or the Middle East took the survey, and 1.3% of designers were from Southeast Asia (not China).
Those results reflect the distribution of the survey, not the actual distribution of designers.
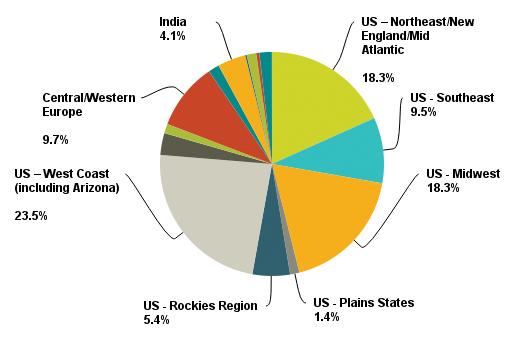
Figure 1. Respondents by location. (n = 443)
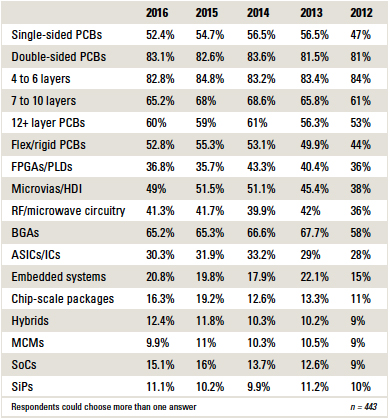
A design team at Denso made the Guinness Book of World Records for producing a 129-layer board. But while flex circuits and higher layer counts continue to make the news, the reality is much more mundane. More than four-fifths of designers still layout double-sided boards, and more than half report some single-sided designs. Three-fifths of respondents do 12 layer and above designs, and more than half design rigid-flex PCBs. More designers reported working on embedded systems and system-in-package this year as well. Regional variances could account for technology trends (TABLE 3).
Table 3. Projects and Technology Trends
The number of designs produced each year is rising, at least until designers reach 20 designs. In 2015, 27% of designers said they produce 21 or more designs, while less than 20% said the same this year. However, designers who produce between six and 20 designs annually rose from 55% last year to 62.6% in 2016. Fewer than 18% indicated producing one to five designs annually.
The median response in terms of the number of designers in each respondent’s company was six to 10. Some 15% work for companies employing only one designer, and another 15% are part of design forces of 51 or more (FIGURE 2).
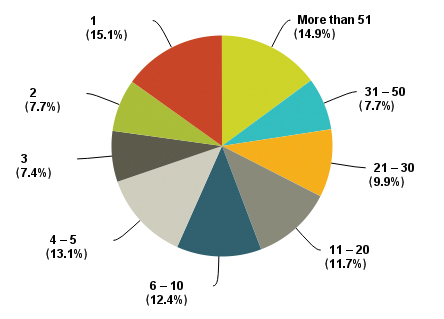
Figure 2. Number of designers per company. (n = 443)
North America remains the largest region where companies employ designers, according to results; however, the North American numbers are down from 89% last year to nearly 86% this year. Europe was up to almost 32% from below 29% in the 2015 survey, and China decreased to 15% from 19% in the previous survey. Other regions were comparable with last year’s responses (FIGURE 3).
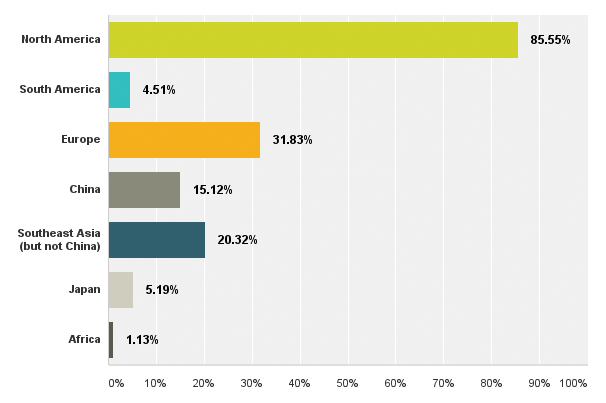
Figure 3. Respondents by region. (n = 443)
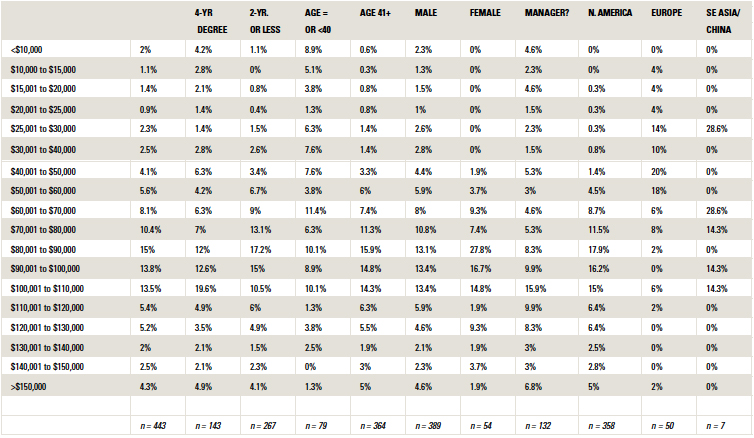
If results are any indication, salaries continue to slowly escalate as designers tack on more years of experience. Nearly 62% of respondents said they make more than $80,000 annually, up from 58% in 2015. The modal response (most frequently occurring) was $80,001 to $90,000, at 15%. Designers who make $20,000 or less held steady at about 4%, while four-fifths of respondents made more than $50,000 (TABLE 4). Asked how salaries had changed compared to the past year, 75% of designers said their salaries rose, flat with 2015. Four percent of salaries fell, compared to less than 3% last year, and 21% said their salaries didn’t change, flat with the previous survey.
Table 4. Average Annual Salary, by Segment
More than half of designers who took the survey receive an annual bonus (52%). Annual bonus percentages may be on the upswing, with more than 27% stating they received a bonus of greater than 7% of their annual salaries, up from 24% last year.
Job security is strong, with 95% of designers reporting they have the same job as last year. Layoffs were down slightly, with 2% of responses compared to 3% in 2015.
Once upon a time, designers were worried about outsourcing much more than other challenges; those days are long gone. Workload continues to be the biggest concern now, with over 58% of designers stating so, up from 56.7% in 2015. In contrast, 18% of designers worry about outsourcing, down from 21% last year.
Technology is a concern for 36% of designers, flat with 2015, and more than a quarter of designers (27%) said they worry about finding and keeping a job, compared to 26% in the previous survey.
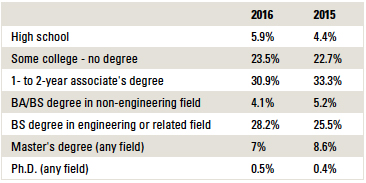
Designers with engineering-related bachelor’s degrees are up to more than 28% in 2016, according to the survey results, compared to 25% last year. Those who have “some college” to graduate degrees encompassed 94% of this year’s respondents, down from 96% in 2015, while designers with “some college” to as much as an associate’s degree accounted for 54% of those who took the survey, down from 56% in the prior year (TABLE 5).
Table 5. Highest Level of Education
Of designers who have a four-year degree, electrical engineering topped the list again with the most responses, up slightly to 69%, compared to 67% in 2015.
Other engineering degrees remained flat at about 10%. “Other” bachelor’s degrees outside of physics, math, business, and liberal arts – which all received less than 4% of responses each – accounted for nearly 12%.
IPC certification may be on the rise, as nearly 37% of respondents said they hold that designation, compared to 32% last year. Fifty-eight percent of those certified said they have CID certification, up from 55% in 2015; those who are CID+ certified accounted for 42% of certified designers who took the survey, down from 45% in 2015.
One-fifth of respondents design primarily for government/military/aerospace/avionics/marine/space applications. Industrial controls/equipment/robotics once again held steadfast in second place, with 19%, compared to below 16% last year. Communications/related systems equipment (including all phone types) was third, with 16% of responses. Consumer electronics (including wearables and white goods) reserved fourth place, with just under 10% of responses, a slight increase from last year. All other categories received below 7% of responses each.
While the vast majority of designers have some say in products or services procurement, only about 13% can approve those purchases. That said, the picture of which products and services designers can evaluate, recommend, specify or approve looks quite the same as in past years, with CAD software (surprise!)
remaining in the top position (83%). Nearly 60% of designers have a say in where prototype PCBs are purchased, and a third or more influence decisions for outside design or assembly services (32%). More than 30% make the call on component decisions as well.
For the first time, designers were asked about their level of job satisfaction, with 1 being completely dissatisfied and 7 being completely satisfied. Responses indicate a majority of designers are content in their current positions, with 57% indicating a 5 or 6 rating, and another 16% answering a 7. Only 2% were completely dissatisfied (FIGURE 4).
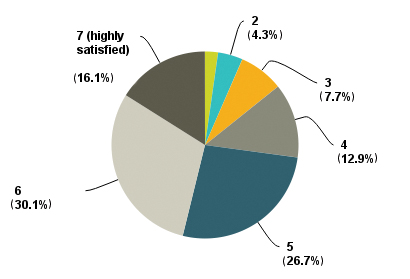
Figure 4. Designers’ job satisfaction (7 = highest, 1 = lowest).
Staff sizes stayed consistent with 2015 numbers, according to survey results, with 55% indicating their company has more than 1,000 employees worldwide, compared to almost 54% in 2015. Another 13% work for firms that have 251 to 1,000 employees, up from 11% last year. Less than 7% of responses came from designers who work with a staff of nine or fewer, up from below 6% in the previous survey.
Seventy percent of designers who took this year’s survey said they have no workers reporting directly to them. More than 23% said they are responsible for overseeing one to five staff members. Less than 7% manage more than six other employees.
Not surprisingly, large staff numbers correlate with high annual sales. Twenty-two percent of respondents work for firms with annual revenues of $5 billion or more.
Another 13% said their company’s sales are in the $1 billion to $4.9 billion range. The second-highest response, however, was $5 million to $49.9 million (15.6%), while 11% said their company brings in less than $5 million per year. More than 19% of designers were unsure of their firm’s annual revenues.
More than 58% of designers indicated their company provides on-the-job training, nearly flat with previous survey results. Fifty-five percent said their firm provides them with the opportunity to attend conference classes, up nearly three percentage points. Almost 59% receive tuition reimbursement, compared to 57% of respondents in 2015. Nearly 42% have company-sponsored classes, compared to below 39% last year. Mentoring dropped to below 33%, compared to nearly 36% in 2015.
About 89% of respondents receive health insurance; 76% are provided dental insurance, and roughly 73% have access to life insurance and 401(k) plans. Each of the overall benefit responses was down one to two percentage points in this year’s results.
As experienced designers plan for retirement, the industry bustles, and few young engineers stand poised to take the torch that inevitably needs passing, here are some important questions: Where and how did experts begin to learn their craft? How can veterans pass on this knowledge to school-age learners? What can be done to excite a generation and bring them into the fray? Employers, current designers and educators alike must work together to ensure there’s a qualified community of new innovative designers ready to thrive.
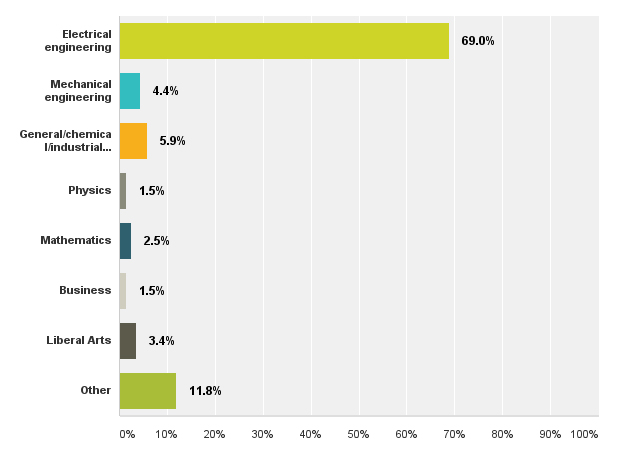
Figure 5. Four-year degrees by subject. (n = 203)
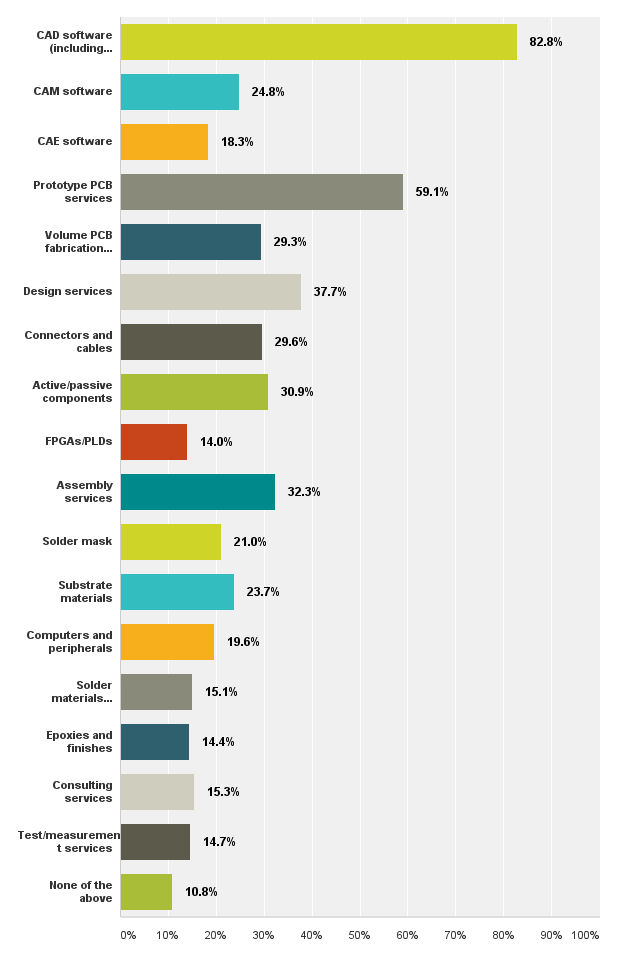
Figure 6. Product/service purchases designers evaluate, recommend, specify or approve. (Respondents checked all that apply.) (n = 443)
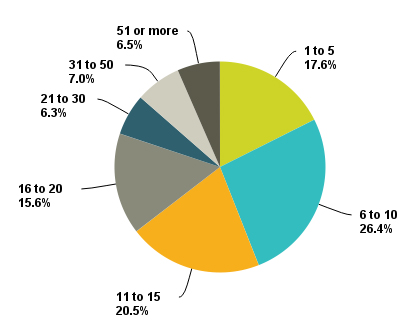
Figure 7. Annual designs produced. (n = 443)
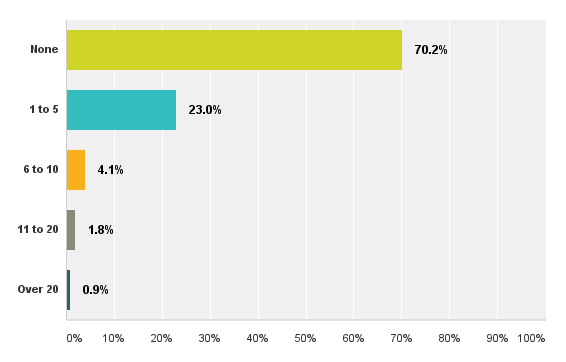
Figure 8. Number of staff members who report directly to designers surveyed. (n = 443)
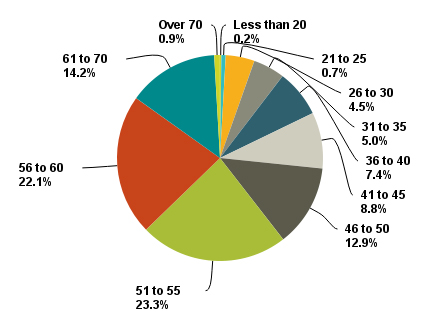
Figure 9. Designers’ current ages. (n = 443)
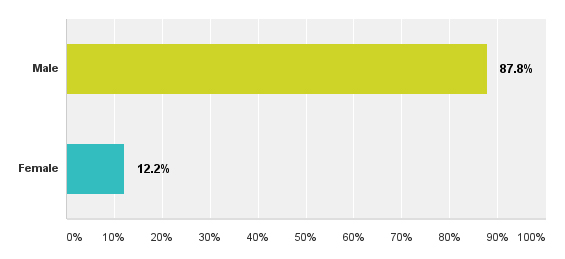
Figure 10. Designers by gender. (n = 443)
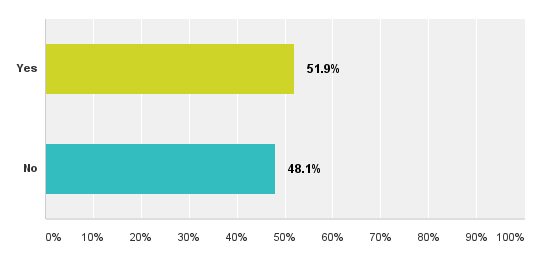
Figure 11. Annual bonuses received. (n = 443)
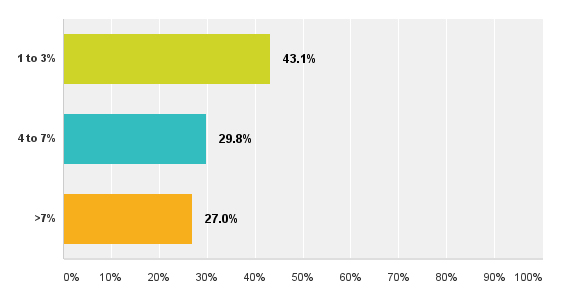
Figure 12. Bonuses by percentage of current salary. (n = 248)
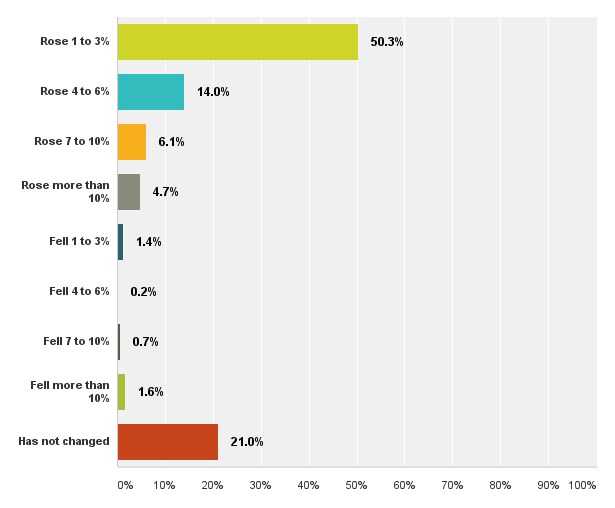
Figure 13. Salary changes in the past year. (n = 443)
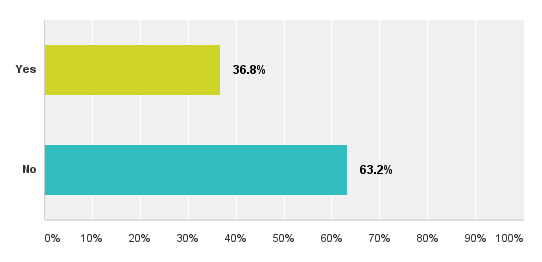
Figure 14. IPC certification. (n = 443)
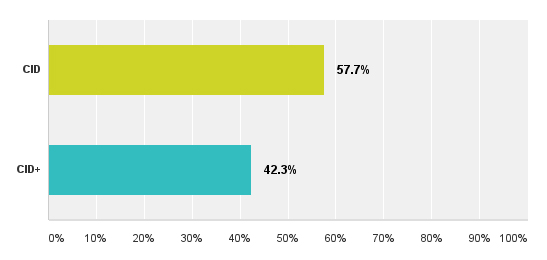
Figure 15. IPC certification by type. (n = 163)
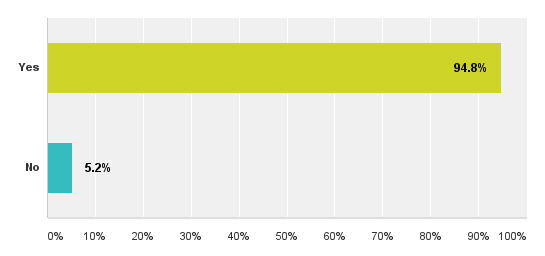
Figure 16. Job retained since 2015. (n = 443)
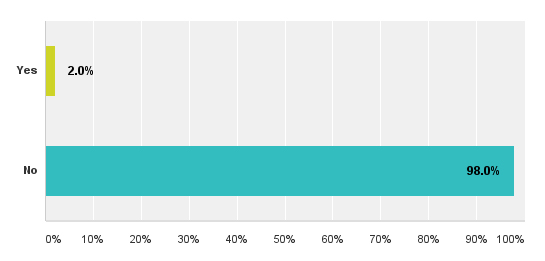
Figure 17. Layoffs in the past year. (n = 443)
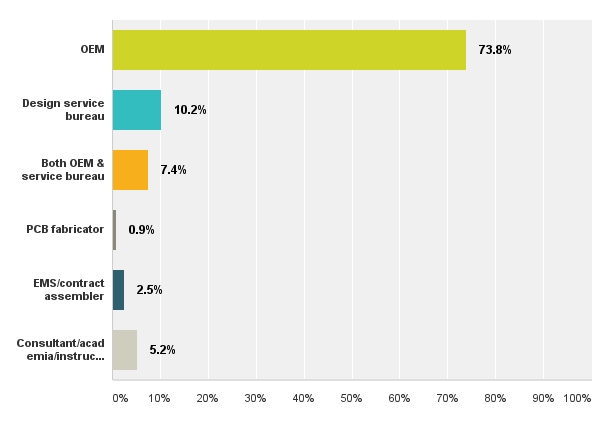
Figure 18. Designers’ employer by type. (n = 443)
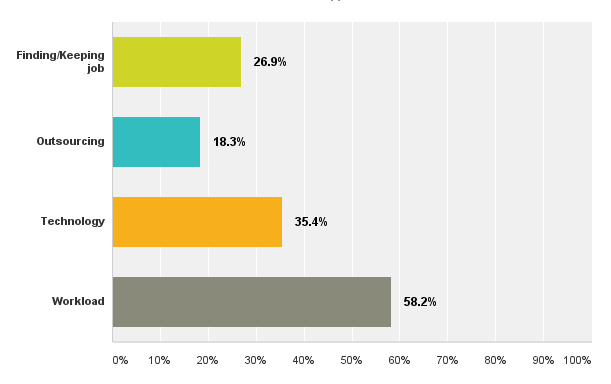
Figure 19. Designers’ biggest 2016 challenges. (Respondents checked all that apply.) (n = 443)
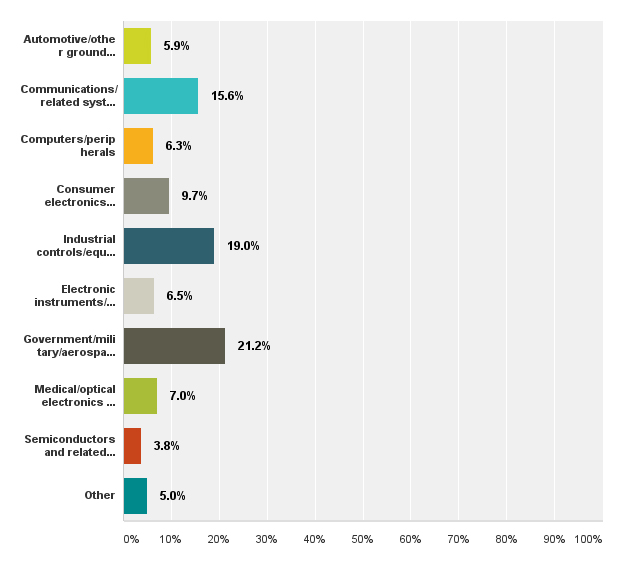
Figure 20. Designs by end market. (n = 443)
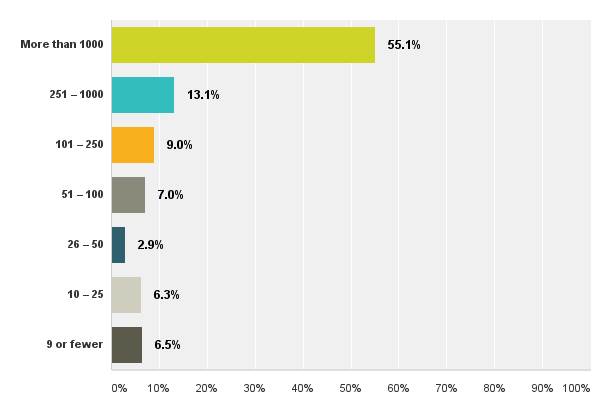
Figure 21. Total company employees worldwide. (n = 443)
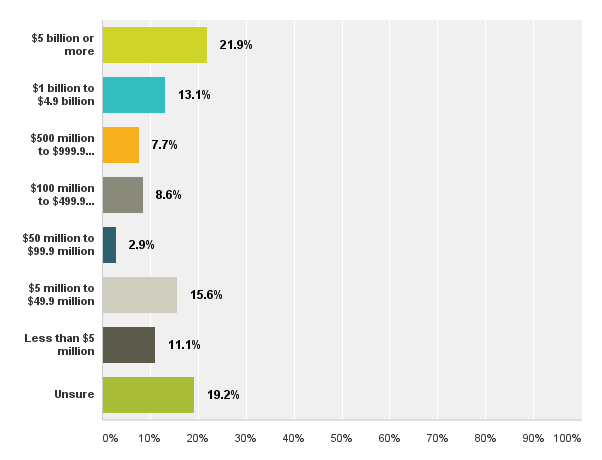
Figure 22. Total annual company sales. (n = 443)
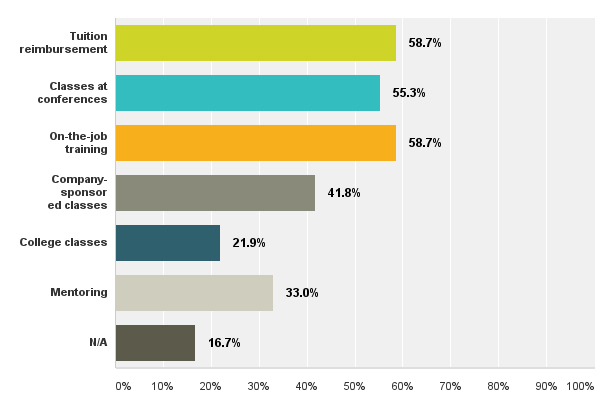
Figure 23. Company educational opportunities. (Respondents checked all that apply.) (n = 443)
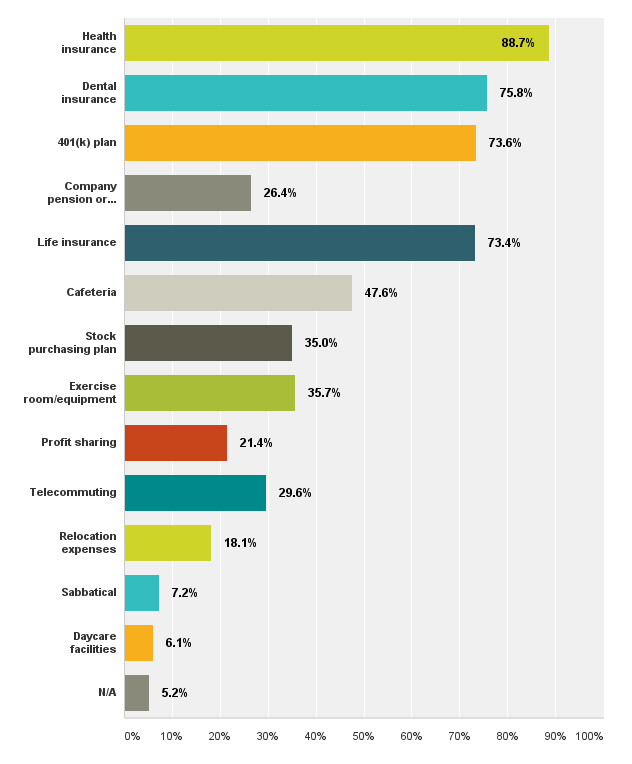
Figure 24. Company benefits. (Respondents checked all that apply.) (n = 443)
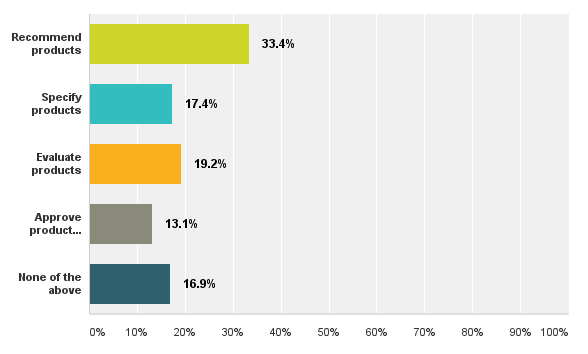
Figure 25. Highest level of purchase power. (n = 443)
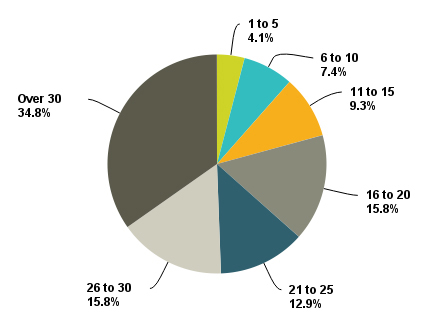
Figure 26. Years of experience in the field. (n = 443)
Chelsey Drysdale is senior editor of PRINTED CIRCUIT DESIGN & FAB; This email address is being protected from spambots. You need JavaScript enabled to view it..
Register now for PCB West, the Silicon Valley's largest trade show for the printed circuit industry, taking place Sept. 13-15 in Santa Clara: PCBWEST.COM


