The background of the measurement specs and tests.
Last month’s column asked, “Whose idea was it to have a dozen different IPC material-measurement standards (for relative permittivity and loss tangent of PCB laminate materials)? Which ones are appropriate or accurate, and in what situations?”
An engineering manager said, “I am still at a loss as to what (Dk/Df) values to use in simulations. When I look at the table (from vendor PowerPoint presentations) and the Dk/Df tables, I see different values. The only numbers that match between the table and plots are those for Df at 10 GHz. (No match at 1 GHz.)”
It's true: The number of possible values available for Dk and Df can be mindboggling. There are PowerPoint presentations from laminate manufacturers, their datasheets, the numbers the fabricator provides, and whatever can be backwards-engineered from your own designs or test vehicles. Most of the time these numbers will not agree. And what’s the difference between a “split-cavity resonator” (SCR) and a “split-post dielectric resonator” (SPDR)? It’s as if you need to join some sort of robe-wearing secret society to learn all the terms, acronyms, and distinctions.
Because of the confusion surrounding dielectric constants (Dk) (which are not constant at all) and loss tangent or dissipation factor (Df), I will devote a few columns to explaining how we got here and where the industry is going. If I clear up some confusion along the way, I have done my job.
Some history on Dk/Df measurement standards. To fully grasp this subject, it’s helpful to understand how we got here. Standards groups like IPC and ASTM accumulate industry practices and test methodologies over time. NIST in particular, and ASTM to a lesser degree, contribute in this space, but I’ll primarily focus on the IPC methods in this column.
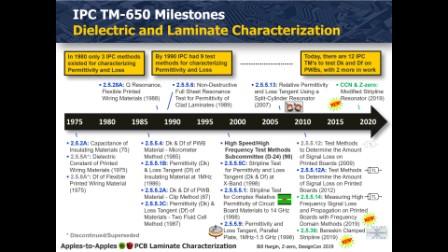
In 1980 – in the formative years of high-speed digital design – there were only three IPC test methods for characterizing permittivity and loss tangent (FIGURE 1). One of the issues with the initial dielectric test standards is they cited frequencies ranging from 1-1000MHz. Laminate manufacturers at the time tended to publish Dk and Df at 1MHz, which persisted well into the 1990s, and it took many years for vendors to report Dk and Df at 1GHz. (Funny side note: IPC-TM-650, method 2.5.2 is titled, “Capacitance of Insulting Materials.” The world is clearly a better place, since annoying materials are being tested.) Fast-forward to 1990 and IPC test methods had been expanded to include nine different test methods. Then, by 2000, the IPC High-Frequency Test Methods Task Group (or D-24c, for those who love acronyms) had been formed, and the number of dielectric test methods for Dk and Df bulged to 12. In the years since, two new test methods have emerged and a few have been superseded. As Figure 1 shows in the bottom right, yet two more new methods are in the oven.

FIGURE 1. The 45-year history of IPC dielectric and laminate characterization methods included three techniques in 1975, and currently includes a dozen methodologies, with two more that should be approved in 2019.
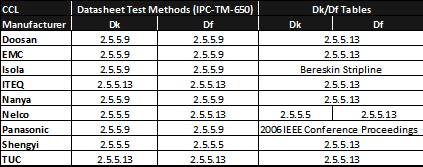
TABLE 1 shows the Dk and Df test methodologies employed by some of the more commonly used high-layer-count epoxy/glass laminate vendors. In case you’re not confused yet, laminate manufacturers may use:
- One test method for datasheets and another for Dk/Df tables.
- One test method at 1GHz and another test method above 1GHz.
- One test method for Dk and another test method for Df.
TABLE 1. Standard Test Methods for Dielectric Testing, by Laminate Manufacturer

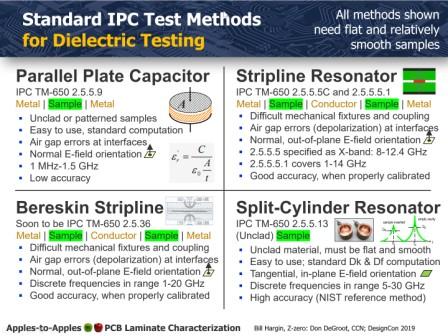
More details on a few of the test standards. A summary of the most commonly used dielectric-characterization methods in the table is shown in FIGURE 2. There are a couple of things to note from these standards. First, the parallel plate capacitor method, 2.5.5.9, is only good up to 1.5GHz. Several laminate vendors use it for datasheet numbers because it’s an easy test. Bereskin stripline, which Isola uses exclusively, has been touted for its accuracy, but most of these methods can produce reasonably accurate results within their specified frequency ranges. But … without proper equipment calibration, and without accounting for manufacturing variation and sample size, it’s common for reasonable measurement standards to produce less-than-accurate Dk and Df results, and these results will be published, propagated and used regardless of quality. (As an old college professor used to say, “There’s many a slip from the cup to the lip.”)

FIGURE 2. Summary of common dielectric test methods employed by laminate manufacturers.
As a final note with the space we have here, three of the four methods shown in Figure 2 employ electric fields normal to the material sample (“out of plane”), while the split-cylinder resonator method used by several laminate manufacturers for their Dk/Df dielectric tables uses E-fields tangential to the x-y plane of the laminate (“in plane”). We’ll discuss the implications in Part III to this series. (Feel free to reach out to me via email to be invited to a webinar on this topic.)
Notwithstanding the above cautionary notes, if I had to recommend a choice of Dk and Df numbers in the short term, I would still suggest using the laminate vendor’s table values, unless you have the time and resources to do your own testing (and ongoing calibration). For signal-integrity simulation, make sure you use table values that account for resin content, material construction and frequency rather than blindly plugging in datasheet values. My website has a tutorial on this.
Bill Hargin has more than 25 years’ experience with signal-integrity software and PCB materials. He is director of everything at Z-zero (z-zero.com); This email address is being protected from spambots. You need JavaScript enabled to view it..


