 Determining tradeoffs among various laminates.
If not for my parents’ objection, I would have been held back in kindergarten. Mrs. Steinbaugh said I just didn’t understand what school was all about. I remember other kids going to play while I tried to figure out how to connect the monkeys by drawing a line between the ones that were doing the same thing in our Think and Do workbook. And now, many years later, I have to confess I’ve had much of the same frustration connecting the monkeys on all the PCB dielectric and laminate-testing standards. Whose idea was it to have a dozen different IPC material-measurement standards? Which ones are appropriate or accurate, and in what situations?
An engineering manager asked me this recently: “I am still at a loss as to what (Dk/Df) values to use in simulations. When I look at the table (from vendor presentations) and the Dk/Df tables, I see different values. The only numbers that match between the table and plots are those for Df at 10GHz. (No match at 1GHz).”
The number of possible values available for Dk and Df can be mind-boggling. You have PowerPoint presentations from laminate manufacturers, their datasheets, whatever numbers your fabricator provides, and whatever you pull out of the inner chasms of your last design. More often than not, these numbers do not agree.
If I had to recommend a choice of Dk and Df numbers in the short-term, I would suggest the laminate vendor’s table values rather than blindly plugging in laminate datasheet values. There are a couple of important reasons for this. Most important is there may be 30 to 40 different dielectric constructions within the same resin system, and they all vary a bit as a function of resin content and frequency, both of which serve to pull Dk down and drive Df and propagation loss up. Datasheets, on the other hand, assume a specific resin content, with frequency values that tend to vary by manufacturer.
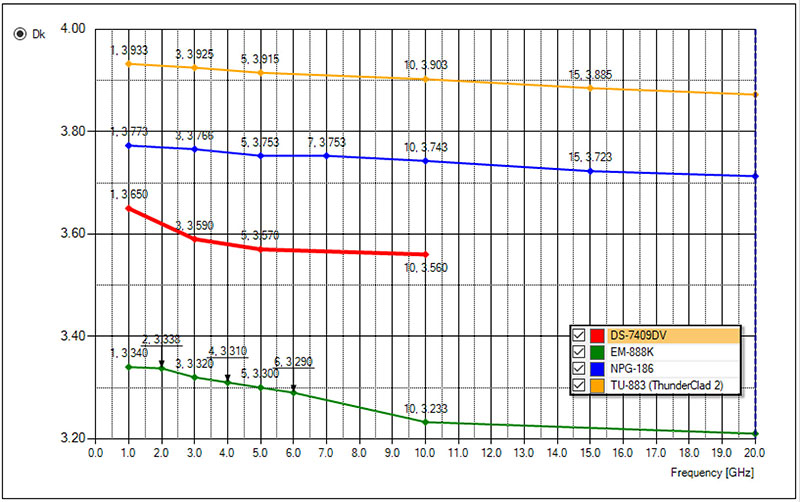
FIGURE 1 shows Dk variation with frequency for a handful of materials from competing laminate vendors. These values are typically used by hardware designers and fabricators for impedance planning. From my experience, PCB fabricators tend to be good about tracking resin content impacts on Dk, but they typically use values at 1GHz since they’re not familiar with the electrical characteristics of a design. If your fastest signals are at a higher frequency – and if you’re reading this, they probably are – it’s advisable to use values associated with your most signal-integrity-sensitive interconnects.

Figure 1. Downward-sloping dielectric constant (Dk) vs. frequency at 50% resin content for a handful of materials. (Values supplied by laminate manufacturers.)
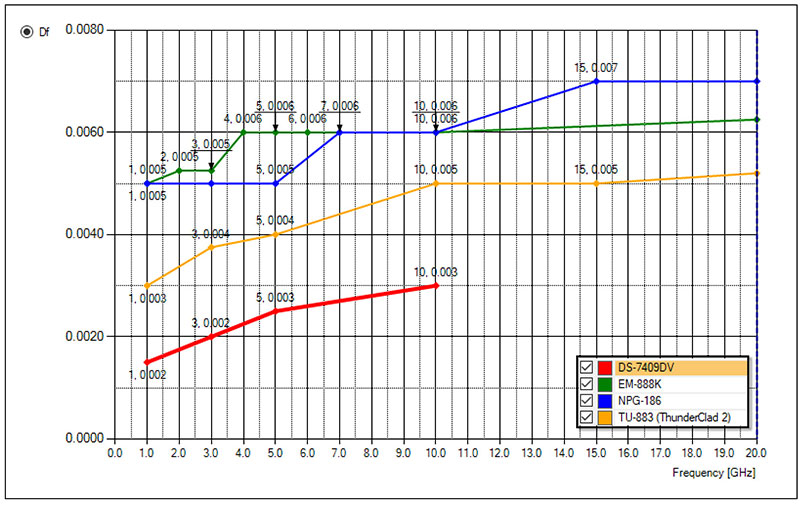
FIGURE 2 shows Df (aka loss tangent or dissipation factor) variation with frequency for the same materials from competing laminate vendors. Loss tangent’s impact on propagation loss is modeled reasonably well in field-solver software, but it’s not something a fabricator commonly tracks on a design. As mentioned, they’re not aware of interconnect speeds or loss budgets. Design teams are well advised to track and simulate this themselves prior to initial prototypes, particularly when selecting laminates. The lower the loss, the higher the cost.

Figure 2. Upward-sloping dissipation factor (Df) vs. frequency at 50% resin content for a handful of materials. (Values supplied by laminate manufacturers.)
A decent laminate library can help with tradeoffs between various laminate alternatives, or test vehicles can be created to compare total loss from one material to the next.
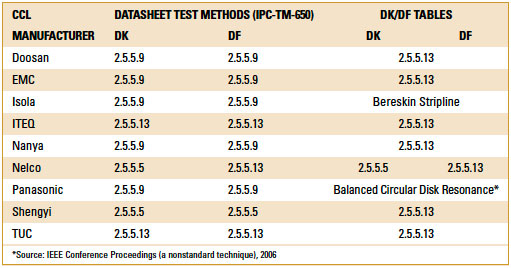
One of the complications with laminate vendor-supplied data is a lot come from different IPC test methods. At DesignCon in January, Dr. Don DeGroot and I will survey a number of the more common test methods noted in TABLE 1, analyzing their accuracy against a well-calibrated test methodology.
Table 1. Standard Test Methods for Dielectric Testing, by Laminate Manufacturer

We don’t have enough room in this column to go into further detail on electrical test methods for dielectrics, but Table 1 shows the Dk and Df test methodologies of some of the more common high-layer-count epoxy/glass laminate vendors. During the conference and a webinar that will follow, we’ll discuss a means for comparing laminates across multiple vendors, and the dozen IPC dielectric and laminate electrical-characterization methods.
It gets pretty confusing, as laminate manufacturers may use:
- One test method for datasheets and another for their Dk/Df tables.
- One test method at 1GHz and another test method above 1GHz.
- One test method for Dk and another test method for Df.
Clearly a topic for a future column. If you’re at DesignCon in January, swing by our presentation, titled Apples-to-Apples Laminate Characterization. Or reach out to me via email to be invited to the webinar by the same name.
Bill Hargin has more than 25 years’ experience with signal-integrity software and PCB materials. He is director of everything at Z-zero (z-zero.com); This email address is being protected from spambots. You need JavaScript enabled to view it..


 Determining tradeoffs among various laminates.


