The in-use environment needs to be part of the model during system design and validation.
Moisture in electronics has been and continues to be a significant concern for system reliability due to its impact on mechanical stresses during thermal cycles, ability to alter adhesion properties, and its corrosive nature when mixed with ionic compounds such as salts. Moisture also affects the electrical properties of a dielectric by altering its dielectric constant and loss tangent1. As IO bus speeds exceed 1 GHz and move toward 5 GHz and beyond, it is becoming critical to system designs that the change in loss with respect to moisture be quantified. At these signaling speeds, small changes in the dielectric material properties can result in failure of electronics systems to communicate across an IO bus. A complicating factor for designers is that the electrical impact due to the moisture concentration within the dielectric is time-dependent and atmospheric condition dependent.
The electrical properties of a material are partially a function of the amount of moisture in the material. The extent to which a material absorbs moisture is characterized by its moisture diffusivity and saturated moisture concentration. Moisture diffusivity describes the rate of change of a material’s moisture concentration. The saturated moisture concentration provides an expression for the limit to the amount of moisture that a material can contain. It is important to note that both are a function of temperature and relative humidity. Another measure of a material’s susceptibility to moisture is its maximum moisture uptake. This is typically reported on material data sheets as %weight and is related to the saturated moisture concentration.
System designers need to be able to determine the typical, minimum and maximum impact of moisture on transmission line loss. This will depend on the system design. Surface microstrips and embedded microstrips are more susceptible to humidity conditions in the environment than striplines. Measurable changes in microstrip losses occur in hours as moisture concentrations change quickly. Transmission lines placed between reference planes, such as striplines, are significantly slower to respond to humidity conditions in the environment. The response time of striplines is measured in weeks or months and is dependent on the continuity and perforation of the reference planes as these provide a barrier to the diffusion of moisture.
Moisture Impact on Transmission Line Loss
A set of test boards was designed to determine the maximum impact of moisture on transmission line loss. In actual computing designs, the power and ground planes are not continuous barriers to moisture absorption perpendicular to the plane of the board. There are anti-pads around each via pad that carry signals between layers and those that provide attach points for through-hole connectors. These provide a path for moisture to diffuse through the PCB. To simulate actual product designs in this experimental design there were via anti-pads regularly distributed across the ground planes, except directly under the transmission lines as shown in Figure 1. Multiple test boards were fabricated and tested with varying distributions of anti-pads to simulate the different levels of plane coverage. All data presented in this section is from test boards having 90% ground plane coverage.
|
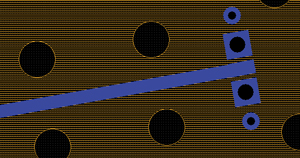
FIGURE 1. Ninety percent power plane coverage.
|
Test boards for this experiment were eight layers with symmetry across the midplane of the board. Three stackups were used: 1080 FR-4, 7628 FR-4 and Rogers 4350 High Frequency Circuit Material. All single-ended (SE) lines were designed to have 50-ohm characteristic impedance. Striplines were connected to the surface layers using microvias to minimize via parasitics and improve the frequency response of the test structures.
All boards were preconditioned for one week at 65?C to remove any residual moisture. All boards were then stored in a dry box at less than 10% relative humidity (RH) and room temperature while dry measurements of S-parameters were made. When this was complete the boards were placed in an environmental chamber kept at 38?C and 95% RH. Measurements of S-parameters were made at regular increasing intervals until the loss reached equilibrium.
Measurements of S-parameters were made using an Agilent 8722ES S-parameter analyzer (VNA). It was calibrated daily using an SOLT calibration standard. The VNA connections to the PCB trace were made using microprobes.
The S11 measurements were not significantly affected by moisture. Figure 2 shows the S21 measurements from the microstrip transmission lines for the three materials at their preconditioned dry state and saturated equilibrium state. The measured loss of microstrips on Rogers RO4350 demonstrated the smallest magnitude shift and smallest percentage change due to moisture. The 7628 FR-4 had a lower overall loss compared to the 1080 FR-4 at each state and demonstrated similar increased loss due to moisture. The measured line losses equilibrated within days to a couple of weeks, depending on material type and thickness of microstrip structure.
|
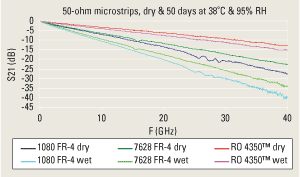
FIGURE 2. S21 of 1080 FR-4, 7628 FR-4 and Rogers 4350 microstrip.
|
Figure 3 shows S21 measurements for striplines on layer three of the same boards as those in Figure 2. Equilibrium delay time for striplines was affected by both their depth into the board and the coverage of the power and ground planes between them and the surface. The measured loss on some combinations of material and ground plane coverage had not reached loss equilibrium after five months of testing. As with the microstrip structures, the Rogers RO4350 demonstrated the smallest magnitude shift and smallest percentage change due to moisture. The longer equilibrium delay time for the stripline structures was expected as the striplines were partially shielded by copper planes. Also, striplines are typically positioned further from the surface of the PCB, forcing moisture to diffuse through the surface substrates to reach the stripline structure.
|
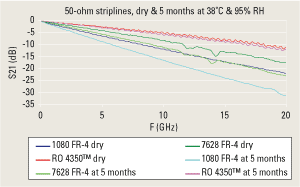
FIGURE 3. S21 of 1080 FR-4, 7628 FR-4 and Rogers 4350 striplines.
|
Fick’s Law of Diffusion was utilized to model the equilibrium delay time and rate of change of measured loss for the microstrip structures (Figure 4).
|
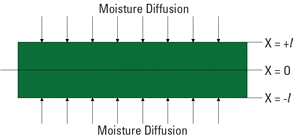
FIGURE 4. Fick’s Law Diffusion model.
|
Impact of Moisture on Loss Tangent and Dielectric Constant
To characterize the loss of only the PCB substrate, a split-post dielectric resonator (SPDR) was used to measure loss tangent (tanδ) and dielectric constant (εr) of bare PCB substrate materials2. No copper or soldermask was present on these PCB samples. The core PCB material was conditioned in two different environmental conditions until equilibrium before measuring εr and tanδ. The measured values of tanδ and εr measured after equilibrium at 20?C and 10% RH and measured again after equilibrium at 38?C and 95% RH are shown in Table 1 [PDF format].
As seen in Table 1, moisture had a significant impact on the loss tangent. The dielectric constant increased slightly with absorption of moisture. The measured loss tangent increased for each measured frequency by 43 to 58% between the two conditions. The change in loss tangent is significant as its magnitude is high and it is directly proportional to the dielectric loss component of measured transmission line loss.
Modeling Moisture Dependent Loss
Fick’s Law of Diffusion is a close analog of the method of Fourier for characterizing and predicting heat flow3. Fick’s law characterizes the time and distance dependent concentration of a solute in a solvent. In the case of modeling moisture dependent loss in PCB substrates, atmospheric moisture is the solute and PCB materials are the solvent. Fick’s law assumes a homogeneous isotropic material as the solvent, but it has been shown to adequately model PCB composites. Fick’s law for single-dimensional diffusion is shown in Equation 1:
Equation 1 states mathematically that the time rate of change of concentration “C” of a solute in a solvent is proportional by constant “D” to the derivative of the concentration gradient of the solute. The constant “D” is known as diffusivity and has units of area/time. Solving Equation 1 by method of separation of variables leads to the general form shown in Equation 2:
where exp(n) denotes the base of natural logarithms, “e”, raised to the power of “n”
The solution of Equation 2 is dependent on the boundary and initial conditions and the geometric dimensions of the sample being modeled. In the case for which the material starts out dry and is placed in an environment of temperature and humidity, the diffusion of moisture occurs from the outer boundary of the material inward. Since the material is much wider than thick, all diffusion is treated as if it were in the x direction only. The material is modeled as an infinite plane of thickness twice “l” as shown in Figure 4.
Solution of Equation 2 using partial fractions and the boundary and initial conditions for two-sided diffusion into an infinite plane is shown in Equation 3:
Where:
C = concentration of solute at time “t” and distance from material center “x”
D = diffusivity (mm2/sec)
x = distance from the center of the material (mm) as in Figure 4
l = ½ thickness of the material (mm) as in Figure 4
t = time (seconds)
Co = equilibrium concentration of the solute at the surface2
As seen in Equation 1, diffusion is gradient-driven. The center of the plane (x = 0) has a zero gradient. Hence, the concentration at any depth except the center at x = 0 is from diffusion from one side of the plane. One could place an impermeable plane in the middle of the sample and have no effect on diffusion and concentration at any location for |x| > 0. In other words, all diffusion into the top half of the material is from the top surface downwards. All diffusion into the bottom half of the material is from the bottom surface upwards. Thus, an impermeable reference plane below a measured trace can be considered a “virtual center” for the purposes of this model and will be at the location x = 0 for the purposes of modeling change in transmission line loss due to moisture absorption with Fick’s law.
Measuring Diffusivity
Test boards were designed to obtain the diffusivity constant Dl describing moisture dependent transmission line loss for 2116 FR-4 at different constructions. By adjusting the layer placement of the transmission line and the reference plane, various depths within the board were obtained for testing. In this design, the distance from the top of a trace to the surface of the board was varied to obtain three unique structures with the distance between a trace and its corresponding reference plane held constant (Figure 5). By keeping the distance between the trace and reference plane constant, the electric field between the trace and plane was held fairly consistent between the three structures. The magnitude of the measured loss of each structure was expected to increase as the representative traces moved further from the surface. There were multiple traces of different lengths designed into each structure. The traces located within Structure A are closest to the board surface and expected to respond quicker to changes in environmental conditions. The traces of Structure C are farthest from the surface and thus expected to respond slowest to changes in environmental conditions. The ground planes were continuous with the exception of the anti-pads required for the connecting vias of the transmission line termination points, thus moisture diffusion was limited to one direction.
|
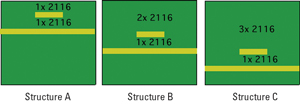
FIGURE 5. Example test board design using 2116 construction.
|
S-parameter measurements were made using a HP 8510C VNA. Calibration of the VNA was accomplished using a standard coaxial SOLT kit prior to each experimental run. Measurement of fixed attenuators during preliminary testing indicated that calibration drift was negligible for the planned test period. The test boards were connected to the VNA through a Kiethley RF Mux that allowed in-situ measurements at the desired environmental conditions. This allowed finer time resolution between measurements. The system also allowed the measurement of multiple structures within the same test board and measurements across multiple test boards without changing termination conditions, and without removing test samples from an environmental chamber for measurement. As a result, it was possible to measure changes in transmission line loss during short environmental transitions, such as changes in temperature.
The test boards were placed in an environmental chamber and connected to the measurement system. Prior to the boards being exposed to high humidity conditions, the boards were baked at 105?C and RH <10% for approximately nine days. This was to ensure the boards contained no initial moisture. After the preconditioning bake, the environmental chamber conditions were ramped down over eight hours to 15?C to measure the temperature impact on transmission line loss in the dry PCB. The environmental chamber was then set to 85?C/85RH until saturation across all structures was obtained. The temperature in the environmental chamber was then ramped down again over eight hours to 15?C, which provided measurement of temperature impact on transmission line loss in a moisture saturated PCB.
Since loss diffusivity, Dl, was derived from trace loss measurements, the variability of the method across different frequencies, trace-to-trace within the same structure, and between structures was examined. Figure 6 shows the results of measuring six individual microstrip traces on 7628 FR-4 at three frequencies. This data reflects a change from 20?C and dry to 38?C and 95% RH. The Dl derived from loss measurements was consistent between different traces and across selected frequencies. Figure 7 shows the variance in derived Dl for 2116 FR-4 using different line lengths and structures. No significant length or structure dependencies were observed. As a result, loss diffusivity was calculated for each tested material that adequately described the loss behavior over time and between different structures. For the 2116 FR-4 material, the typical diffusivity was calculated to be 1.31 X10⁻⁶ mm2/sec at 85?C/85RH. Using a weight-based method, Fremont et al. obtained moisture diffusivity values for an unspecified FR-4 at 85?C/85RH of 1.51 X 10⁻⁶ mm2/sec4. This initial comparison shows close agreement between loss diffusivity derived from fitting hloss hloss (the humidity-induced change in loss from the dry state) to Fick’s law and moisture diffusivity.
|
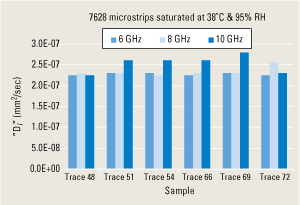
FIGURE 6. Dl for 7628 FR-4.
|
|
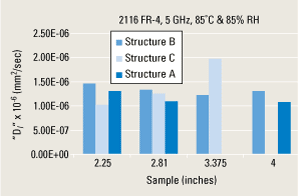
FIGURE 7. Dl for 2116 starting cool and dry.
|
The loss diffusivity measured for 7628 FR-4 and 2116 FR-4, shown in Figures 6 and 7, respectively, cannot be directly compared as each was derived from different environmental conditions. Diffusivity is a function of temperature and relative humidity. At lower temperatures and lower relative humidity the moisture diffusion through the PCB substrate is slower. This was observed in the diffusivities calculated for 2116 FR-4 at 85?C/85RH of 1.3x10⁻⁶ mm2/sec and the diffusivity calculated for 7628 FR-4 at 38?C/95RH at 2.3x10⁻⁷ mm2/sec. It is noted, that even at the same environmental conditions, 2116 FR-4 and 7628 FR-4 would have slightly different diffusivities due to differences in glass fabric construction.
The transmission line loss is a function of temperature and humidity, and must be considered during system design and validation. As noted, the temperature was ramped prior to any change in relative humidity. This provided a measurement of the transmission line loss as a function of temperature at the dry and saturated states as shown in Figure 8. For comparison, the measured loss for the 2116 FR-4 as received was 0.95dB/inch at 25?C. At 25?C, drying improved the transmission line loss by ~0.3dB/inch and moisture increased the loss by 0.65dB/inch when fully saturated. Temperature had a significant affect on loss across the range 15?C to 85?C. And when saturated with moisture, the impact of changing temperature was more pronounced. When dry, the loss changed 0.5dB/inch between 15?C and 85?C. When saturated, the loss changed by 0.85dB/inch between 15?C and 85?C. In relatively small temperature ranges, the critical loss factor was moisture.
|
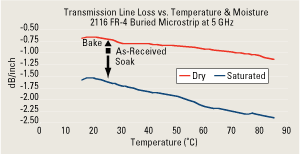
FIGURE 8. Temperature impact on loss at dry and saturated conditions.
|
Conclusions
It has been shown that moisture has a significant impact on the transmission line loss characteristics within a PCB substrate. It has also been shown that temperature affects transmission line loss and influences the significance of humidity dependent loss. As a result, expected environmental conditions need to be considered during system design and validation. PCB substrates respond to changes in temperature faster than changes in relative humidity. Microstrip transmission lines are more sensitive than striplines, as they respond quickly to changes in the relative humidity of the environment and reach saturation within a few days. Striplines change more slowly, with moisture saturation taking weeks and sometimes months. As a result, striplines may not be susceptible to seasonal changes, but variations would exist between two locations due to the average environmental condition.
It has been demonstrated that Fick’s Law of Diffusion can be used to model the humidity dependent losses of a PCB trace. The method provided can be used to determine the loss diffusivity of a desired PCB substrate. The loss diffusivity allows the designer to model the rate of change in transmission line loss due to humidity, and thus predict the electrical performance risk across different environmental conditions. The loss diffusivity also appears to be close to moisture diffusivity, but additional experimental work is required to confirm. It is also shown that the humidity dependent loss does vary with frequency.
Due to the magnitude of humidity dependent loss, end user environmental conditions must be taken into account as they affect board performance. The impact of moisture on the transmission line loss has been confirmed with both direct VNA measurements and split post dielectric resonators (SPDR) on unclad dielectrics. The SPDR measurements confirm that moisture absorption increases the dielectric dissipation factor (tanδ) of a PCB substrate. This change in tanδ as a function of moisture can be included during electrical simulations to determine the design risk across environmental use conditions. In addition, the dielectric constant of the material has also been shown to change with moisture absorption and should be included when modeling moisture impacts during system design and validation. The magnitude of humidity dependent loss in PCB substrates is affected by material selection. It has been shown that a low moisture absorbing material such as Rogers 4350 is not as susceptible to moisture dependent losses as compared to FR-4.
The work presented in this article allows the likelihood of humidity dependent loss in transmission lines under various environmental use conditions to be evaluated. During system design and validation the loss diffusivity and Fick’s law can be used to predict the rate at which hloss increases. The impact of humidity dependent loss on electrical performance can be modeled by adjusting the values of dissipation factor (tanδ) and dielectric constant of the PCB substrate used with transmission line simulation tools. PCD&M
Ed. – This paper previously appeared in the IPC Printed Circuit Expo 2007 Technical Conference Proceedings. It has been edited and is published by PCD&M with the permission of the authors.
Gary Brist is Staff PCB Technologist with Intel; This email address is being protected from spambots. You need JavaScript enabled to view it.. Paul Hamilton is Senior Test Engineer with Tyco; This email address is being protected from spambots. You need JavaScript enabled to view it.. Guy Barnes Jr. (This email address is being protected from spambots. You need JavaScript enabled to view it.) is an RF/Signaling Engineer and Jason Schrader (This email address is being protected from spambots. You need JavaScript enabled to view it.) is a PCB Technologist, both with Intel.
AKNOWLEDGEMENTS
Discussions with and ideas from our Intel associates have materially contributed to this work. These teammates include Dennis Miller, Stephen H. Hall and Bryce Horine. Mark Beaudoin has spent many patient and careful hours executing the first experiment. The authors are obliged for their help.
REFERENCES
1. Khan, Subhotosh; “Comparison of the dielectric constant and dissipation factors of non-woven aramid/FR-4 and glass/FR-4 laminates,” Volume: 26 Issue: 2, Circuit World, June 2000
2. J. Krupka, A.P.; Gregory, O.C.; Rochard, R.N.; Clarke, B.; Riddle, J. Baker-Jarvis, “Uncertainty of Complex Permittivity Measurements by Split-Post Dielectric Resonator Technique,” Journal of the European Ceramic Society, Version 7, 2001
3. Crank, J.; “The Mathematics of Diffusion,” Oxford Science Publications, UK, 1979
4. Fremont, Helene, et al., “Measurements and FE-Simulations of Moisture Distribution in FR4-based Printed Circuit Boards,” 7th Int. Conf. On Thermal, Mechanical and Multiphysics Simulation and Experiments in Micro-Electronics and Micro-Systems, EuroSimE 2006


