Techniques for recognizing and minimizing signal integrity degradation.
Signal integrity analyses frequently involve evaluation of timing margins1 and signal quality, which relates to waveform shapes2.
For low capacitance circuits (fast terminated nets, for example) a digital signal’s shape is approximately trapezoidal3. However, digital signals often contain exponential edges because of the RC time constant of capacitive loads3.
Signal quality degradation can occur due to propagation from source to load through system interconnect.
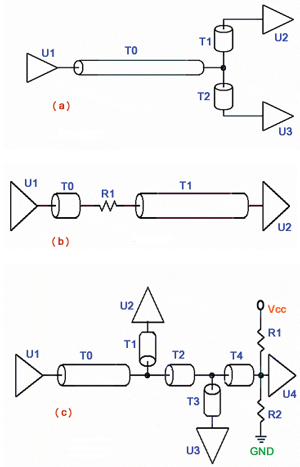
Depicted by Figures 1a, 1b and 1c are three PCB topologies: the Tee, point-to-point and multi-drop. Some desirable topology characteristics4 include symmetry, minimized impedance discontinuities and balanced loading. Figure 1c assumes that connections of resistors R1 and R2 to supply voltages and to U4 are achieved by means of short trace segments not shown in the drawing. Figure 1 also indicates that sometimes termination resistors are required for optimizing signal quality.
|

FIGURE 1. Several options for connecting PCB components: a) Tee topology, b) point-to-point and c) multi-drop.
|
Figure 1 displays only transmission lines, but the driver to receiver path can include other interconnect components such as connectors, cables sockets, etc. A digital signal can get distorted as it travels from driver to receivers.
It is important to know the metrics for quantifying signal quality and the means of managing signal distortion to an acceptable level.
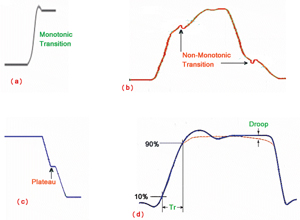
Several features of signal transitions are demonstrated by Figure 2. Figure 2a illustrates a monotonic rising edge, Figure 2b displays non-monotonicity in rising and falling edges. A rising or falling edge is non-monotonic if the edge begins to make a transition but reverses directions two or more times before completing the transition. A falling edge with plateau is depicted by Figure 2c. Plateaus commonly occur for long interconnects3 and can result in added delay and timing issues. Illustrated by Figure 2d is the 10 to 90% rise time Tr of the signal. The rise or fall times may be also measured from 0 to 100%, or 20 to 80% points1. Also indicated is droop – a brief voltage drop. Power droop may prevent the power delivery system from supplying required current, cause timing push-out2 and adverse signal integrity effects.
|

FIGURE 2. Signal edges displaying: a) monotonicity, b) glitches, c) plateau and d) droop.
|
When the topology includes few impedance discontinuities, multiple reflection effects may be analyzed by applying the lattice (bounce) diagram for linear systems or the Bergeron diagram for non-linear systems2. Both the single-ended and differential nets can be also analyzed with aid of mathematical software such as Matlab or Mathcad5. For complex net topologies, a SPICE-based software is frequently utilized for waveform analyses.
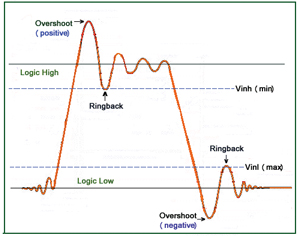
Ringing, transient decaying oscillation, about high or low limits, induced by unmatched impedance reflections, is a common type of digital signal distortion6. Overshoot, as shown by Figure 3, is the initial transient response that exceeds the steady state response. Ringback relates to the amount by which a signal rebounds after an overshoot has occurred. Signal distortions associated with ringing, overshoot or ringback are considered analog effects, indicating that digital signals are naturally analog3. High-level input voltage (Vih), and low-level input voltage (Vil) are voltage values required to switch the output of the input buffer to a high and to a low state, respectively.
|

FIGURE 3. A digital signal exhibiting overshoot and ringback.
|
Some signaling standards, such as SSTL_2 logic7 specifications, define threshold values for both ac and dc input signals. The ac thresholds (i.e., Vih – ac, Vil – ac) dictate the levels at which the receiver must satisfy its timing specs. The dc thresholds (i.e., Vih –dc, Vil – dc) define the final logic state (i.e., receiver will switch and maintain new logic state, once the dc threshold has been crossed).
Furthermore, certain interfaces such as DDR7 and GTL8 also define an input reference voltage Vref, which is related to Vih, Vil, supply and termination voltages. For instance, for DDR7 minimum value of Vih (dc) equals (Vref + 0.18) and maximum Vil (dc) equals (Vref – 0.18).
Another notable type of signal quality degradation is inter-symbol interference (ISI). It is a distortion of the received signal manifested in an overlap of individual pulses to the level that the receiver cannot reliably distinguish between changes of state.
Accurate analyses of certain high-speed effects such as ISI and jitter often require capturing a series of pulses rather than a single edge or one pulse. Eye diagrams2, often produced by utilizing a large number of randomly generated bits, offer a convenient and powerful graphical technique for evaluating signal quality degradations, noise margins and timing jitter5.
A term sometimes applied for appraisal of waveform oscillations is “settling time.” It measures the time interval needed for oscillations to dampen to a level that will not increase the next cycle’s flight time. For instance, the settling time8 limit for Pentium II operating at 100 MHz is 10 ns. This implies that oscillation amplitudes have dampened to within +/- 10% of signal swing prior to the next transition.
The undesirable effects which contribute to signal integrity problems may be divided into three broad categories: 1) signal integrity problems associated with a single net6, 2) crosstalk between two or more nets and 3) signal integrity degradations due to power distribution system (PDS) or rail collapse. It is critical to ensure that total noise caused by such sources does not exceed the noise margin that is determined by the gap between the range of input and output voltage swings.
As an example, for LVTTL logic family, Voh (min) = 2.4V, Vih (min) = 2.0V yields a noise margin9 of 400 mV. This defines the amount not be exceeded by various noise sources.
Three powerful approaches for managing high-speed effects/noise include optimizing technology, topology and termination. This implies selecting a driver chip with slowest edge-rate, which is sufficiently fast to meet functional requirements. The topology design needs to meet timing while minimizing reflection and crosstalk effects. The termination scheme should utilize passive components and effectively dampen signal reflections. Technology, topology and termination10 are sometimes called “the three Ts.” PCD&M
Dr. Abe (Abbas) Riazi is a senior staff electronic design scientist with ServerWorks (a Broadcom Company) in Santa Clara, CA. He can be reached at This email address is being protected from spambots. You need JavaScript enabled to view it..
REFERENCES
1. Abe Riazi, “Timing Analysis Principles for Digital PCBs, Part 1,” Printed Circuit Design and Manufacture, April 2006, PP. 20-21.
2. Stephen H. Hall, Garrett W. Hall, James A. McCall, “High-Speed Digital System Design A Handbook of Interconnect Theory and Design Practices,” John Wiley and Sons Inc., 2000. PP. 21-33, PP. 141-142, PP. 189-209.
3. Brian Young, “Digital Signal Integrity Modeling and Simulation with Interconnect and Packages,” Prentice Hall, 2000, PP. 12-14, PP. 40-49.
4. Abe Riazi, “Topology Characteristics of Reliable Bus Design,” Printed Circuit Design and Manufacture, February 2006, PP. 18-19.
5. David Norte, “Learn Signal Integrity Design Principles With Mathcad,” The EMC, Signal And Power Integrity Institute, 2005, PP. 5-18, PP. 41-48.
6. Eric Bogatin, “It’s a Wonder Anything Ever Works,” Printed Circuit Design and Manufacture, August 2005, P. 48.
7. “Stub Series Terminated Logic For 2.5 Volts (SSTL_2),” EIA/JESD8-9, Sep. 1998, PP. 2-4.
8. “100 MHz GTL+ Layout Guidelines for the Pentium II Processor and Intel 440BX AGPset,” Intel Application Note AP-827, 1997, PP. 10-14.
9. Lee W. Ritchey, “Right The First Time: A Practical Handbook On High-Speed PCB And System Design, Vol. 1,” Speeding Edge 2003, PP. 185-195.
10. Bill Hargin, “Managing Signal Quality,” Xcell Journal, Second Quarter 2005.


