Laminate comparisons are complicated because of the array of tests to specify loss characteristics.
For her MIT master’s thesis in engineering, Michelle Rybak investigated signal loss over frequency of six different PCB laminates, with special attention to distinguishing the resistive loss by the copper from the loss caused by dielectric absorption (see http://dspace.mit.edu/handle/1721.1/91866). Her research stemmed from interest by NetApp, where she worked, to identify materials that would be best suited for some anticipated server products. Comparing materials based on the dielectric properties cited on data sheets can be problematic, as her thesis points out, because the method used to obtain those data varies among laminate manufacturers; the discrete frequencies at which Df values are reported are inconsistent, and the resin content among laminates of interest may not match.
Apart from the disparities in how laminate manufacturers determine and report Df, whether the behavior of a laminate can be accurately predicted across a broad spectrum simply by extrapolating between a published value for Df at a low frequency and one at a high frequency was in question. Rybak sought a simple, dependable method for evaluating laminate loss that can separate conductor loss from dielectric loss and also reveal the effect of copper roughness on signal integrity.
Selecting the best laminate for a board that will be produced in volume requires balancing performance and cost. The lower their loss, the more expensive laminates tend to be. Only if there is a reliable way to determine and compare laminate performance can the most economical choice be found.
For companies that plan to build a product in volume, Rybak’s investigation illustrates that for a modest investment, competing laminates that might satisfy the product requirements according to data sheets can be directly compared in a simple test environment to identify which one that achieves performance goals is the least expensive. There may be only pennies of difference in the prices of those compared laminates, but such a small difference can amount to a great deal of money over the run of a product produced in volume.
Rybak explored several established methods for characterizing loss, weighing their merits and liabilities in her paper. She settled on the Stripline S-Parameter Sweep (S3) method1, augmented by an approach presented in 2013 by Bogatin, et al.2 Those authors described a feedback-based model that in particular can yield the specific contribution of copper roughness to loss, without knowing the actual surface geometry but relying on profile information as supplied by vendors for standard, VLP, and RTF foil versions, etc. The six laminates Rybak studied included Nanya NPLD II; Nanya NPG-170D; Isola I-Speed IS; Panasonic Megtron 4; Elite Materials EM-888, and an outlier, Panasonic Megtron 6, whose advertised Df is much lower than the other materials and whose cost is higher (TABLE 1).
Table 1. JEDEC Designation of Solder Powder Types

Basically, Rybak’s study involved creating a PCB test vehicle as described by the S3 method, measuring the S-parameters of 50Ω striplines within the various dielectric materials of the test vehicle, establishing a mathematical model to simulate the result of conductor and dielectric losses over frequency, then changing the values of the model parameters for dielectric and conductor loss until the simulation fit the results for insertion loss for the striplines stemming from the S-parameter tests. In that way, loss factors for the dielectrics over a range of frequencies were extracted, as were the effects of copper finish.
The investigation employed the wideband Debye mathematical model to calculate dielectric loss, using the Svensson-Djordjevic approximation. Bogatin and Degroot describe this numerical framework in detail.3 Essentially, Dk is assumed to have a logarithmic relationship to frequency, and a value for Dk and Df at one frequency determines the slope of Dk graphed across a spectrum, from which Df at other frequencies can be computed.
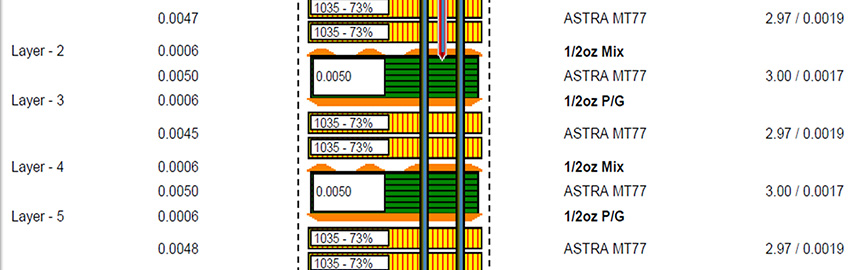
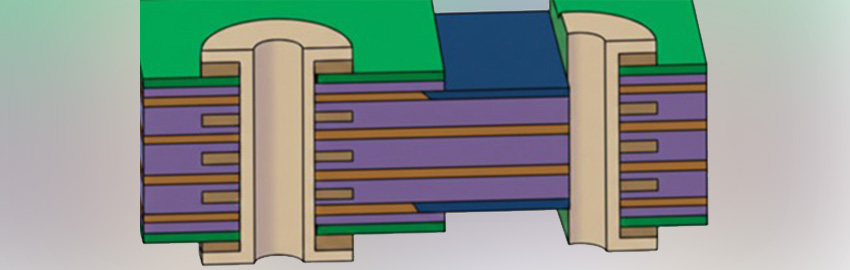
As part of the investigation, Sierra Circuits fabricated 10 six-layer panels as test vehicles. Each panel is composed of different combinations of dielectric material, foil type (very low-profile and otherwise), and oxide treatment. The variations enabled comparison of the dielectrics and also permitted analysis of how well the feedback model could isolate the effect of copper roughness.
S-parameter measurements were performed using an Agilent N5230C vector network analyzer and Agilent ADS software, referenced to TRL (Thru, Reflect, and Line/Match) calibration striplines each test vehicle incorporated. MATLAB was used to implement the S3 algorithm. A Polar Instruments Si9000 transmission line field solver was used for impedance calculations. Insertion loss for each material resulting from the measurements is graphed in FIGURE 1.

Figure 1. Comparison of results of measured insertion loss for materials listed in Table 1.
Insofar as Dk and Df can be simulated and graphed across a spectrum per their relationship under the Svensson-Djordjevic approximation, based on a value for Dk and Df at one frequency within that spectrum, a comparison with test data is simple. Rybak varied the input parameters Dk at 1GHz, Df at 1GHz, and a figure for the effect of surface roughness, to reach the best fit possible of the simulated data to the measured data. When constrained by the fixed parameters of the model – the conductor and dielectric cross-sections of the test vehicle, along with copper conductivity – and an approximate value for the contribution of surface roughness, she found that achieving a good fit meant either overestimating values at lower frequencies or underestimating values at higher frequencies.
Rybak concluded that the values for Df at high frequencies that were listed in the material datasheets were consistently too low. Moreover, she determined that copper roughness, though not an insignificant factor, contributed very little to loss even at elevated frequency. In addition, the study clearly distinguished the differences in electrical performance among the materials, thereby enabling an informed purchase choice.
Low-profile copper is now almost ubiquitous among laminates for applications that will operate at 2GHz or beyond, so the effect of surface finish is nearly moot.
But Rybak’s study underscores the need for a common yardstick among laminate manufacturers for specifying product performance, and the immediate value of her test environment to companies for qualifying materials for high-volume production applications.
References
1. G. Antonini, J. L. Drewniak, M. Y. Koledintseva, A. Orlandi, K. N. Rozanov and J. Zhang, “Planar Transmission Line Method for Characterization of Printed Circuit Board Dielectrics,” Progress In Electromagnetics Research, PIER 102, pp. 267-286, 2010.
2. E. Bogatin, D. DeGroot, “Frequency Dependent Material Properties: So What?” DesignCon, February 2010.
3. E. Bogatin, D. DeGroot, P. Huray and Y. Shlepnev, “Which One Is Better? Comparing Options to Describe Frequency Dependent Losses,” DesignCon, January 2013.
Amit Bahl is vice president, sales and marketing at Sierra Circuits; This email address is being protected from spambots. You need JavaScript enabled to view it..