Our annual survey finds a quarter of PCB designers are nearing retirement, but salaries have never been higher.
If a recent survey is any indication, printed circuit board designers are becoming an even more experienced crowd and have concerns about their workload, yet their salaries are increasing slightly with age.
From May 1 to June 30, a total of 421 bare board designers responded to PCD&F’s annual salary survey. The online survey covered salaries, job functions, titles, project types and quantity, benefits, education, experience, career challenges, locations, ages, and company demographics, to name some. Results are intended to provide a snapshot of the state of design industry jobs, not a meticulous scientific study.
Of the 421 respondents, just over half (50.4%) say they are senior PCB designers, down from 56% in the 2012 survey. PCB designers account for 16.9% of respondents, compared to 15% last year. Other common job titles include design engineer (7.6%), PCB design manager (7.6%), hardware engineer (4.3%), and senior engineer (3.6%). CAD librarians made up 2.6% of those responding.
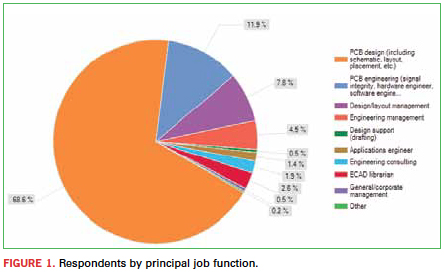
As in 2012, respondents overwhelmingly say their principal job function is PCB design (including schematic, layout, placement, etc.) (Figure 1). Next is PCB engineering, with 11.9% of responses, followed by design/layout management, engineering management, and ECAD librarian.
The majority of designers continue to work for OEMs (66.3%). Another 11.2% work for design service bureaus, compared to 10% in the previous year. Strikingly, relatively few – 1.9% – of respondents indicated they work for a contract assembler, despite the increase in those services among EMS providers.
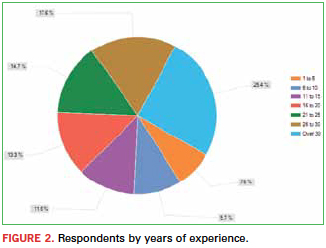
As the 2012 and 2013 surveys have shown, for a significant portion of designers, retirement is looming. Over a quarter of respondents (25.4%) have more than 30 years’ experience in the business, compared to 21% last year (Figure 2). Some 57.7% of participants in this year’s survey have more than 20 years of experience, compared to 53% in 2012. Only 17.3% say they have 10 or fewer years’ experience, flat with 2012.
Along those lines, 24.9% of respondents are between the ages of 51 and 55, the demographic most represented in the survey. More than half (58.6%) fall between 46 and 60, compared to 55% last year. In 2013, 8.8% of respondents are 60 to 70 years old, compared to 10% in 2012, and two respondents are over 70. In the younger age brackets, 10.2% are 41 to 45, flat with last year, and 14.7% are 31 to 40, down from 16% last year. Just 7.1% are 30 or younger, and no one who responded to the survey is younger than 20.
The demographic of designers is still resoundingly male, with 89.3% of responses, up from 86% in 2012’s survey.
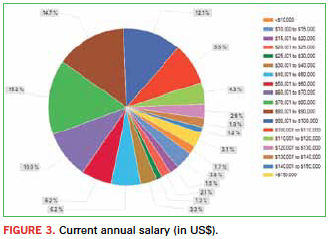
Top earners. With the veteran population growing in the design industry, so are salaries. The top earners make over $150,000. Nearly one-third of designers make between $70,000 and $90,000 a year (Figure 3), and 34.1% earn more than $90,000, compared to 28% last year. Of the designers who took the survey, 74% make more than $60,000, up one percentage point from 2012. Only 7.2% bring in $20,000 or less, compared to 8% last year.
While the clear majority of respondents say their salaries increased in the past year – 72%, up from 69% in 2012 – the increases were modest, with 48.2% of respondents’ salaries growing 1 to 3%. Another 14.3% say their salary rose 4 to 6%, and 6.2% report a salary increase of 7 to 10%. More than 21% of survey respondents say their salary did not change in the past year. About 7% of respondents said their salary decreased, which was consistent with the previous survey.
More than half the respondents say they did not receive an annual bonus in the most recent year (53.4%). In the 2012 survey, 56% said they did not receive a bonus. Though the frequency of bonuses appears to have improved, based on responses, the amounts are less. Of those who recently received a bonus, 55.1% say the extra cash, on average, is 1 to 3% of their current salary, compared to 43% of respondents in 2012. Another 24.4% say 4 to 7%, down from 29% last year, and 20.5% say more than 7% of their salary, compared to 28% in 2012.
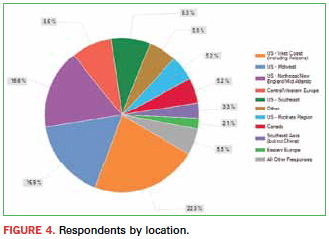
A vast majority of respondents say they live in the US (70.7%) (Figure 4); this figure is slightly down from 73% in the 2012 survey. The West Coast of the US (including Arizona) accounted for 22.3% of respondents, compared to 23% last year. Another 16.9% live in the Midwest, while 16.6% are in the Northeast/New England/Mid-Atlantic. Some 8.6% of responses came from Central/Western Europe, compared to 9% last year. There were a trickle of respondents from China, perhaps owing to the survey only being conducted in English. Two designers from Africa/Middle East responded, however.
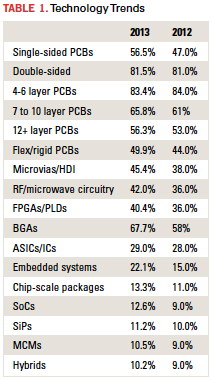
Tech trends. Technology is always advancing, but sometimes not as fast as we would think. Designers were asked what types of projects and/or technologies they directly engineer, design or lay out. The most common response? Four to 6 layer PCBs, followed by double-sided boards. Yet use of BGAs, CSPs, HDI and embedded systems are on the rise (Table 1).
More than a quarter of the designers who responded to the survey (25.2%) say they produce, on average, 6 to 10 new designs each year, down from 29% last year. Another 21.1% say they produce 11 to 15 new designs annually, up from 18% in 2012. Just over 15% produce 1 to 5, flat with the previous survey, and 11.9% say 16 to 20 new designs, compared to 14% last year. Some 10.2% produce 21 to 30 new designs, on average, annually, up from 8% in 2012. Another 16.4% produce more than 30, nearly flat with last year.
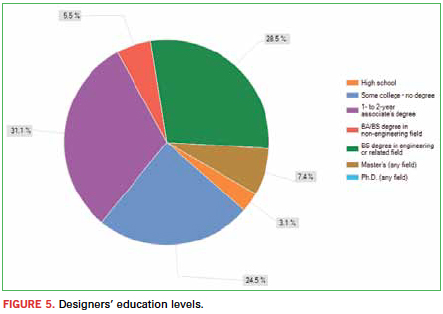
Designers are an educated group (Figure 5). More than 31% say they have a one to two-year associate’s degree; another 24.5% have some college, but no degree, for a total of 55.6%, compared to 60% in 2012. More designers this year say they have a bachelor’s degree in engineering or a related field (28.5%), up from 21% last year. Fewer designers this year reported either a master’s degree or Ph.D.
Fewer designers also say they are an IPC Certified Designer (30.9%); in 2012, this number was 33%. Of the designers who are IPC certified, 57% say they are CID; 43% say CID+.
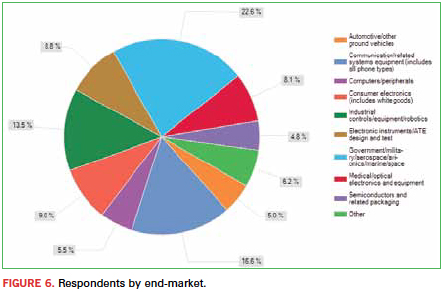
Government/military/aerospace/avionics/marine/space garnered the most responses (again) when designers were asked which end-market they primarily design for, with 22.6%, compared to 23% who said “high-reliability products” last year (Figure 6). Communications/related systems equipment (including all phone types) is a close second, with 16.6%. Industrial controls/equipment/robotics received 13.5% of responses, and consumer electronics another 9%, down from 11% in 2012. Other end-markets are electronic instruments/ATE design and test (8.8%); medical/optical electronics and equipment (8.1%); other (6.2%); computers/peripherals (5.5%); automotive/other ground vehicles (5%), and semiconductors and related packaging (4.8%).
Designers are keeping their jobs. Some 93.3% say they have the same job as 2012, up from 91% in the previous survey. Nearly 7% were laid off in the past year, comparable with the 2012 survey.
Workload is still designers’ biggest challenge, with 51.8% stating so, up from 49% in 2012. Other challenges include technology (35.6%), nearly flat with 2012, and finding/keeping one’s job (34.9%), also flat with last year. Outsourcing received fewer responses than the previous survey, with 22.1%, down from 25%.
A large portion (72.9%) of designers who completed the survey do not have other staff members reporting directly to them. Some 18.8% say they have 1 to 5 people reporting to them, nearly flat with last year. Only 4.8% say they have six to 10 people reporting to them, and another 2.1% oversee 11 to 20 staff. Just over 1% have more than 20 employees reporting directly to them.
When asked their highest level of purchasing power, 31.8% of designers say they recommend products, down from 36% last year. Some 23% evaluate products, up from 20% in 2012. Another 17.6% have the ability to specify products, compared to 17% last year, and 12.1% approve product purchases, up from 8% in the prior survey.
Among the products and services evaluated, recommended, specified or approved, CAD software led with 78.9%. Prototype PCB services garnered 56.5% of responses, while design services pulled in 36.6%. Here’s how the rest of the list breaks down:
- Active/passive components: 30.4%
- Connectors and cables: 29.9%
- Assembly services: 29.7%
- Volume PCB fabrication services: 28%
- CAM software: 27.8%
- Substrate materials: 20.9%
- Solder mask: 20.7%
- Computers and peripherals: 19%
- CAE software: 18.1%
- FPGAs/PLDs: 15.4%
- Consulting services: 15.2%
- Solder materials (paste, flux): 12.8%
- Epoxies and finishes: 11.6%
- Test/measurement services: 11.4%
Designers still work for large firms. When asked how many staff members their company employs, 43.7% said more than 1000, up from 40% in 2012. Another 16.4% work for firms with 251-1000 employees, compared to 18% last year. About 10% work at companies with 101-250 employees, down from 13% in 2012. Other responses include 51 to 100 employees (7.4%); 26 to 50 employees (6.7%), and 25 or fewer staff members (15.7%), compared to 14% in 2012.
The distribution by company revenue was fairly even. Between 7% and 11% worked for firms with sales of less than $5 million, $50 million to $100 million, $100 million to $500 million, and $500 million to $1 billion. Fifteen percent work for firms with annual sales topping $5 billion; 13.8% work at companies with sales of $1 billion to $5 billion, and 16.4% work for firms with sales of $5 million to $50 million.
The picture of company benefits looks remarkably similar to data compiled in 2012. Leading the way again is health insurance, with 86.9% of companies offering this, and 73.9% offering dental insurance. Life insurance is provided to 72.4%, and some 67% are offered a 401(k) plan. All these figures are consistent with the 2012 survey. Other benefits include:
- Cafeteria: 44.4%
- Stock purchasing plan: 33%
- Company pension or retirement plan: 28.7%
- Exercise room/equipment: 28.7%
- Profit sharing: 24%
- Telecommuting: 20.7%
- Relocation expenses: 14.3%
- Daycare facilities: 4.3%
- Sabbatical: 4%
Many companies support educational opportunities, with tuition reimbursement leading responses at 56.1%. On-the-job training is supported by 50.6% of companies who employ survey respondents. About 45% reimburse for conferences, and about 40% conduct company classes. Mentoring is supported by 27.1%, and college classes are supported by 18.1%.
To view results of the 2012 survey, visit http://pcdandf.com/cms/component/content/article/246-2012-articles/8976-designers-salary-survey.
Chelsey Drysdale is senior editor for PCD&F/Circuits Assembly; This email address is being protected from spambots. You need JavaScript enabled to view it..