New glass fabrics reduce glass weave to signal line interaction and help designers meet tighter skew specifications for high-speed systems.
The signal channels that link high-speed processors to memory and various other peripherals are limited by the inherent characteristics of the printed circuit board; these are what ultimately connect information to the outside world. One limiting factor is fiber weave effect (FWE), the effect of glass fiber distributed irregularly in the printed circuit substrate material. FWE introduces signal skew and timing errors, which place an upper limit on bit rate and trace length.
Using unique fabrication techniques and a proprietary low dielectric constant glass composition, a glass fabric is presented that is essentially free of FWE, while demonstrating inherently improved resistance to conductive anodic filament (CAF) formation. Improved laminate performance is demonstrated with finite element modeling and HyperLynx simulations and corroborated with dielectric property measurements on prototype substrates.
A PCB using this material demonstrates superior signal integrity performance over the traditional glass-based solution. By uniformly distributing glass fibers, the maximum surface area becomes available to bond with the resin, which is enhanced by a direct finish application that provides a high quality interface between glass and resin. Two high-profile performance issues, FWE and CAF, are addressed by a unique laminate reinforcement.
Introduction to FWE
FWE is a performance-limiting factor due to a nonhomogeneous spatial distribution of dielectric constant (Dk) of the PCB substrate. It becomes significant at 3 Gbps signaling design and beyond. Except under special circumstances, this discontinuous distribution is inherent to all glass fiber-reinforced laminate systems.
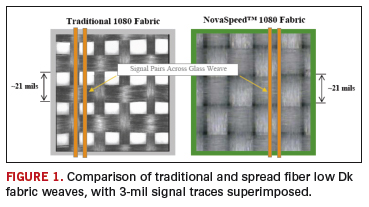
In the glass fabric, the warp and weft yarns form a weave pattern, where the glass bundles are at 0, 1 and 2 yarn thicknesses (FIGURE 1). The cross points have 2 yarn thicknesses and are often referred to as “knuckles”; the gaps between yarns have 0 yarn thickness. Each of these weave pattern features determines a localized Dk, and the boundary between each feature defines a spatial Dk discontinuity. The localized discontinuity is proportional to the difference in Dk (∆Dk) between the reinforcing glass fabric and the resin system.
Consider the localized contribution of each weave pattern feature, where the glass fabric style defines the dimension and magnitude of each localized Dk in a laminate system. The respective displacements of resin at 0, 1 and 2 glass yarn thicknesses define the Dk of each feature. In each of the three cases, these features induce a signal propagation delay along their associated conductor lengths.
When compared to a traditional glass fabric, as shown in Figure 1, a spread fiber fabric has an exceptionally uniform distribution of glass fibers. This allows it to overcome a major contributor to FWE, which is the weave pattern itself. Note that both fabrics shown are Style 1080 with equal amounts of glass. Optimization of the entire glass fabric manufacturing process, with respect to these considerations, results in a superior signal integrity solution at the laminate level.
A proprietary low Dk glass composition overcomes a second contributor to FWE, which is the difference in Dk between the glass and the resin. There is an underlying phenomenon at play when considering the implication of FWE. Not only is it a result of areas of differential glass and resin content, but also the difference of glass versus resin Dk. A novel spread fiber, low Dk glass fabric addresses both of these factors by offering a unique reinforcement with superior glass fiber distribution for PCB laminates.1
As a signal propagates along a trace conductor in a typical glass fabric-reinforced laminate system, the localized composite Dk determines the signal propagation velocity and incremental propagation delay. Differences in propagation delay between signal pairs result in signal skew. Skew is defined (in EIA JEDEC Standard JESD65B) as “The magnitude of the time difference between two events that ideally would occur simultaneously.”2 The variations in signal skew, such as occur in differential signaling, determine the maximum bit rate obtainable on such a system. A variation in the accumulated propagation delay between conductor pairs is the total skew for a differential signal. Each signal trace has its own unique response, resulting in FWE-induced signal integrity limitations to high-speed system performance.
Performance Modeling and Verification
To assess system performance and predict the benefit of laminate materials, an internal tool was developed using finite element modeling (FEM). It predicts the ∆Dk of the worst case scenario across a differential signal on any laminate system. Starting with glass and resin dielectric properties, an array of elements was modeled based on a standard fabric construction, as shown in Figure 1. By modeling copper traces aligned with the weave pattern and by maximizing intra-pair ∆Dk, a worst case scenario of intra-pair propagation delay will result. At a given conductor length, the difference of intra-pair propagation delays is calculated from the velocity equation as used by Loyer et al.3 This difference in propagation delay is skew. The FEM model gives a statistically worst-case scenario and corroborates with an Intel study of nearly 60,000 data points analyzing skew.3,4 The model predicts a significant difference between the spread fiber low Dk and traditional E-glass fabrics, if all other parasitic effects are held constant. The prediction is an order of magnitude reduction in signal skew related to fiber weave effect.
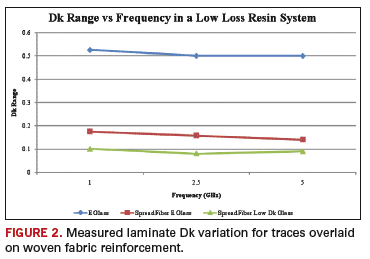
To confirm the validity of this prediction, test panels were fabricated using traditional E-glass (as shown in Figure 1) and two versions of spread fiber fabric, one using E-glass and the other using low Dk glass. The test pattern included an array of traces overlaid on the woven glass structure. By measuring trace impedance, laminate Dk is calculated as a function of location. The max-to-min range of laminate Dk was measured at three frequencies for each of the three different test panel constructions, as shown in FIGURE 2. These same ranges of laminate Dk values were calculated using the finite element model, with the model results and averages from Figure 2 given in TABLE 1. For the two cases of a spread fiber configuration, the modeling is nearly identical to the measured values. The measured ∆Dk values were produced from a laminate built up from several layers of glass fabric. The model predictions are based on a single layer of fabric and give a more likely worst-case range of values, independent of sample size.
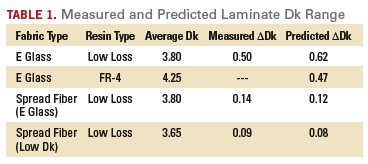
In comparing the predicted values of Dk to the measured values from test panels, it is confirmed that the finite element model gives accurate performance estimates. Validation of ∆Dk prediction, with real samples, allows for further extrapolation (FR-4). More importantly, the spread fiber glass configuration demonstrates a significant reduction in Dk variation, and therefore, a corresponding decrease in signal skew due to fiber weave effect.
HyperLynx Simulation
Fiber weave effect was simulated using Mentor Graphics’ HyperLynx GHz software. This allows an assessment of the impact on signal integrity and further corroboration of the performance predictions. Pairs of microstrip traces were specified with different (max. or min.) laminate dielectric constants, as calculated from the average and ∆Dk values given in Table 1. These corresponded to whether each trace in a pair was located over a glass strand (longer signal propagation delay) or between glass strands (shorter propagation delay). The HyperLynx LineSim model for a 100-ohm, 24-inch microstrip using spread fiber low Dk glass is shown in FIGURE 3.
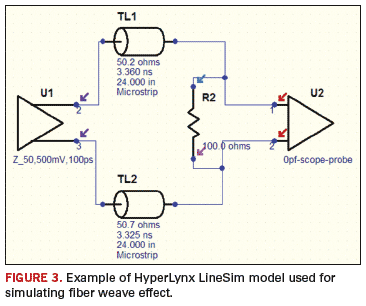
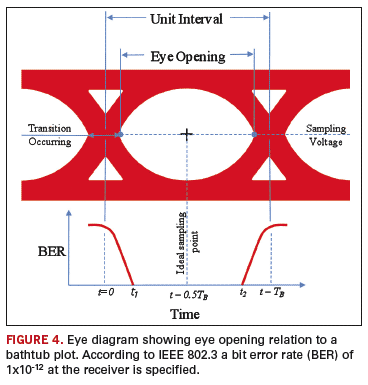
To simulate fiber weave effect on a differential pair requires a ∆Dk across the respective traces. This is achieved in HyperLynx by modeling two microstrips with substrate dielectric constants of average Dk plus ∆Dk/2 and average Dk minus ∆Dk/2, respectively. HyperLynx generates eye diagrams and bit error rate (BER) plots (also called bathtub plots). An illustrative pictorial of an eye diagram is shown in FIGURE 4. Eye opening is defined as the width of the eye as a proportion of the unit interval (TB). The accepted standard5 for system performance is a BER of less than 1 in 1012. This is the metric used for determining the bit rate at a given trace length that is achievable on various laminate systems. In the region of interest, it can be shown that signal skew is proportional to ∆Dk. As bit rate increases for a given skew, the skew portion of a bit interval increases, and eye opening is decreased.
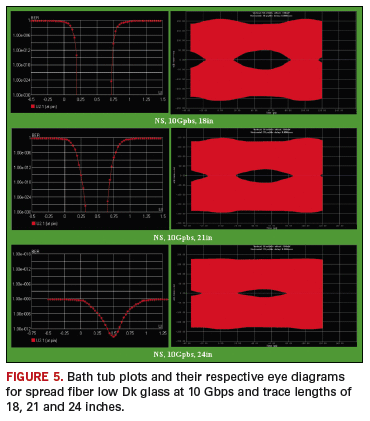
The simulation was run with a 10-bit pseudo random binary sequence (PRBS), at increasing bit rates and trace lengths, while monitoring bit error rate and reduction of eye opening. As an example, FIGURE 5 shows bit error rates and eye diagrams for spread fiber low Dk glass at 10 Gbps and trace lengths of 18 inches, 21 inches and 24 inches. At 24 inches, the eye opening shrinks to 0.2 TB.
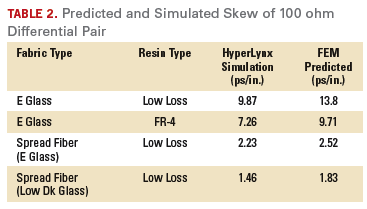
The HyperLynx simulations also report propagation delays from which signal skew can be calculated. These are compared to the signal skews predicted by the FEM model and further corroborate the calculations, as shown in TABLE 2. The HyperLynx simulation used actual laminate and copper designs, which take into account trace and laminate geometry and dielectric properties.
Simulations were run at 2.5 Gbps, 5.0 Gbps, 7.5 Gbps and 10 Gbps, and increasing trace lengths, to determine the maximum bit rate and length at which an eye opening of 0.32 TB and BER of 1x10-12 is achieved. The results are shown in FIGURE 6 for four different laminate systems. The simulations at 10 Gbps showed moderate signal degradation at the driver. It is expected that all of the laminate systems tested would perform marginally better at 10 Gbps than in the simulations.
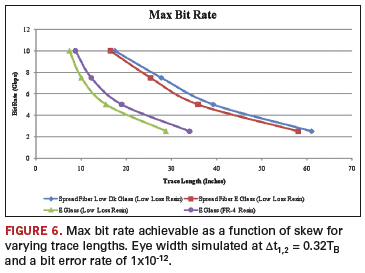
As seen in Figure 6, the traditional fabric is limited to about 8-inch trace length at 10 GHz, compared to over 16 inches for either of the spread fiber fabrics. It is an interesting point that the simulation indicates slightly better performance for the standard FR-4 resin than for a high-end, low-loss resin regarding fiber weave effect. This is because fiber weave effect is driven by the difference in dielectric constant between the resin and the glass reinforcement. FR-4 has a higher dielectric constant than the low-loss resin and is closer in value to E glass. As expected, the spread fiber low Dk fabric has better performance than spread fiber E glass and demonstrates the best performance of the four systems simulated. Overall, the spread fiber fabrics allow either a doubling of trace length or a doubling of bit rate, as compared to traditional fabric in the range of 2.5 Gbps to 10 Gbps.
CAF Resistance
Spread fiber glass fabrics with a direct finish were expected to offer improved resistance to conductive anodic filament (CAF) formation, and this is now demonstrated. By spreading the glass fibers, the maximum surface area becomes available to bond with the resin, while direct application of a finish (no heat cleaning) provides a high quality interface between glass and resin. This results in a very robust laminate with excellent hydrolysis resistance and improved immunity to electrochemical migration (ECM) failures. CAF is a type of ECM failure that typically occurs at the glass fiber-to-resin interface.
To assess the benefit of both spread fiber low Dk glass fabric and spread fiber E glass fabric as compared to traditional technology, an aggressive testing regimen was performed. Three sets of test boards were fabricated. A commercially available high Tg CAF-resistant laminate system (made with traditional E glass) was used for the control. Laminates and prepreg were then made using the same commercial high Tg resin system with the spread fiber low Dk glass and spread fiber E glass fabrics. The boards were baked and subjected to four consecutive reflow cycles at either 245ËšC or 260ËšC, as might be experienced using lead-free assembly processes allowing for rework. Then a typical CAF resistance test was performed, similar to IPC-TM-650 2.6.25.6 The purpose of the reflow cycles was to force measurable failure rates while staying within ranges of temperature and humidity that could be experienced in fabrication and operation.

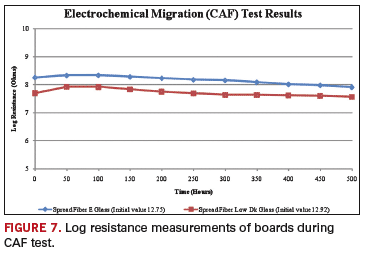
Test results from this aggressive regimen, shown in TABLE 3, demonstrate that a common high-end CAF-resistant system exhibited ECM/CAF failures in every instance. In both versions of spread fiber fabric, a significant proportion of the boards passed the test. Curves representing average Log resistance are shown in FIGURE 7 for the passing test boards. There was insufficient data to generate a curve for the test boards using traditional E glass fabric. It should be noted that both of the spread fiber fabrics were manufactured using a proprietary direct finish technology for an improved glass-to-resin interface.1 Furthermore, an analysis of actual failures suggests that an effective approach to improving CAF resistance is to treat the substrate as a high-performance composite and design for superior hydrolysis resistance.
Hollow Fibers
ECM/CAF failures are known to have occurred due to hollow fibers in the glass reinforcement. While the appearance of hollow fibers is relatively infrequent today with traditional E glass, commercial low Dk glass yarn faces unique manufacturing challenges associated with high temperature glass melting. The proprietary spread fiber low Dk glass fabric used for these tests is certified to be hollow fiber free and fully wets when impregnated with resin.
Additional Considerations
Homogeneous glass fabric allows for an even distribution of energy during the laser ablation process. Consequently, laser drilled microvias are processed faster and cleaner with fewer failures. Mechanically drilled holes are also more uniform and minimize damage and separation between the resin and glass fibers. This was amply demonstrated in the CAF testing results, which show a much more robust composite than that produced using traditional substrate materials.
Conclusion
The request has been made for the industry to provide a solution to Fiber Weave Effect. Many solutions have been proposed to mitigate FWE.3,7 However, we propose that to eliminate FWE it must be addressed at the earliest stages of manufacture: at glass fabric manufacture. By solving the two contributing factors to FWE, ∆Dk and homogeneous fiber distribution, this new technology is the complete and unique solution to FWE. Based on finite element modeling, HyperLynx simulations and subsequent verification by measurement, a new level of high-speed design is anticipated using existing FR-4 processable resin systems. Eric Bogatin alluded to increasing difficulties meeting tighter skew specifications in systems over 3 Gbps, due to glass weave / signal line interactions.8 The use of new spread fiber glass fabrics with low-loss resins have demonstrated the capability to reduce skew by nearly an order of magnitude and to permit designs up to 10 Gbps and beyond.
The proposed solution of a spread fiber glass fabric using direct finish technology has also demonstrated significant performance advantages beyond elimination of FWE. It appears that, with spread fiber technology, elimination of FWE and CAF resistance are integrally connected. The use of advanced composite technology offers an improved resin-glass interface and demonstrates superior CAF resistance. Two performance issues are addressed with one unique product.
To date, test results have verified the modeling and the prediction of FWE elimination, as well as material characteristics such as CAF resistance, laser drilling and other requisites of a performance material solution. Further work is in progress to empirically define performance capability, particularly in the area beyond 10 Gbps. PCD&F
ACKNOWLEDGEMENT
The authors wish to thank: Mentor Graphics; Greg Salvino of Trilogic; Gary Brist of Intel Corporation; and Chris Mahanna at Robisan Test Labs for their assistance and advice.
REFERENCES
- R. Dudek, P. Goldman, J. Kuhn, “Advanced Glass Reinforcement Technology for Improved Signal Integrity,” Printed Circuit Design & Fab, February 2008.
- EIA JEDEC Standard JESD65B, “Definition of Skew Specifications for Standard Logic Devices,” Sept. 2003, JEDEC Solid State Technology Association.
- J. Loyer, R. Kunze, X. Ye, “Fiber Weave Effect: Practical Impact Analysis and Mitigation Strategies,” CircuiTree, March 2007.
- G. Brist, B. Horine, G. Long, “High-speed Interconnects: The Impact of Spatial Electrical Properties of PCB due to Woven Glass Reinforcement Patterns,” S18-5-1, IPC Expo/SMEMA Council/APEX/Designers Summit 2004.
IEEE 802.3, www.ieee802.org.
- IPC-TM-650 2.6.25 “Conductive Anodic Filament (CAF) Resistance Test: X-Y Axis,” Nov. 2003, IPC-Association Connecting Electronics Industries.
- S. McMorrow, C. Heard, “The Impact of PCB Laminate Weave on the Electrical Performance of Differential Signaling at Multi-Gigabit Data Rates,” DesignCon East 2005.
- E. Bogatin, “Skewering Skew,” Printed Circuit Design & Manufacture, April 2005.
Russel S. Dudek Jr. is the technology specialist at Compunetics; This email address is being protected from spambots. You need JavaScript enabled to view it.. John J. Kuhn is VP and CTO at Dielectric Solutions; This email address is being protected from spambots. You need JavaScript enabled to view it.. Patricia Goldman is manager, technical services at Dielectric Solutions; This email address is being protected from spambots. You need JavaScript enabled to view it..


