A flexible printed circuit board, also known as a flex PCB, is an electronic circuit that is built on a flexible substrate, allowing the board to bend, fold or twist during use. Unlike traditional rigid PCBs, flex PCBs are designed to fit into compact, lightweight and dynamically moving electronic products. Flex PCBs are widely used in modern electronics such as smartphones, wearables, medical devices, automotive systems and aerospace applications, where the ability to flex is required and space, weight and reliability are critical.
Written by Chris Parker, Martin Anslem, Ph.D., and Francisco Aguilar
Category: Features
A study shows how high-thermal dielectrics outperform FR-4 for bulk heat spreading, with surface-mount thermal bridges serving as targeted tools for hotspot control.
As power density continues to increase across power electronics, industrial controls, automotive electrification and data center infrastructure, printed circuit boards (PCBs) are increasingly required to function as active thermal management structures rather than passive interconnect platforms. Localized hotspots, rising junction temperatures and constrained form factors are pushing conventional FR-4 substrates beyond their practical thermal limits. In response, PCB designers are adopting a combination of material-level improvements within the PCB stackup and localized heat-spreading solutions. One such approach is the use of surface-mount thermal bridges (SMTBs), passive SMT components designed to conduct heat away from power devices and redistribute it into larger copper regions of the PCB without providing an electrical function.
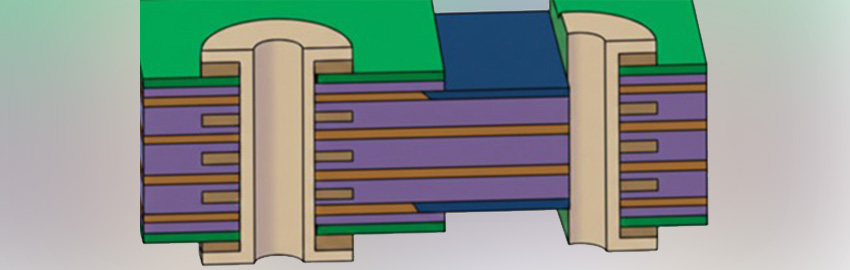
Copper-filled microvias, controlled aspect ratios and fabrication-aware design are redefining vias.
If you want a front-row seat to the evolution of PCB technology, look no further than vias. While ultra-fine lines tend to capture the spotlight, real transformation is happening in the via structures that connect those lines from layer to layer.
Vias are no longer simple drill-and-plate features. In ultra HDI, they are engineered elements that require the right geometry, material set and process window to work.
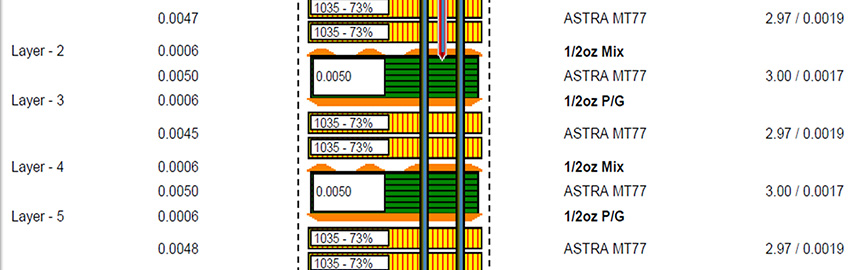
How polyimide core technology determines whether electronics survive extreme conditions.
Deciding which processes and materials to adopt for a PCB design depends on the designer’s awareness of the factors that influence those decisions. For example, which regions are targeted for your product? The supply chain cycles for materials are greatly impacted by geography and demographics. What are the limits of environmental conditions (heat and pressure, etc.) the product will be exposed to? Such factors also affect the choice of materials used in PCB manufacturing. Similarly, your awareness about the purpose, the scope and the type of industry that will use the product will also help you choose the right materials and processes for manufacture.
Leveraging artificial obsolescence to operationalize the domestic supply chain.
In my previous article, we explored the 1941 Victory Plan as a masterclass in industrial foresight, where the US moved from isolation to becoming the “Great Arsenal of Democracy.” As President Franklin Delano Roosevelt noted in 19401 the goal was not just to design weapons, but to produce them in sufficient volume to save future generations the “agony and suffering of war.” Today, as we face a new era of near-peer competition, the Victory Plan has been reborn, with a new focus shaped by the modern battlefield. While the 1940s emphasis was on steel and aircraft, our current challenge lies in the rapid, high-volume production of electronics and sensors like those that power modern unmanned systems.
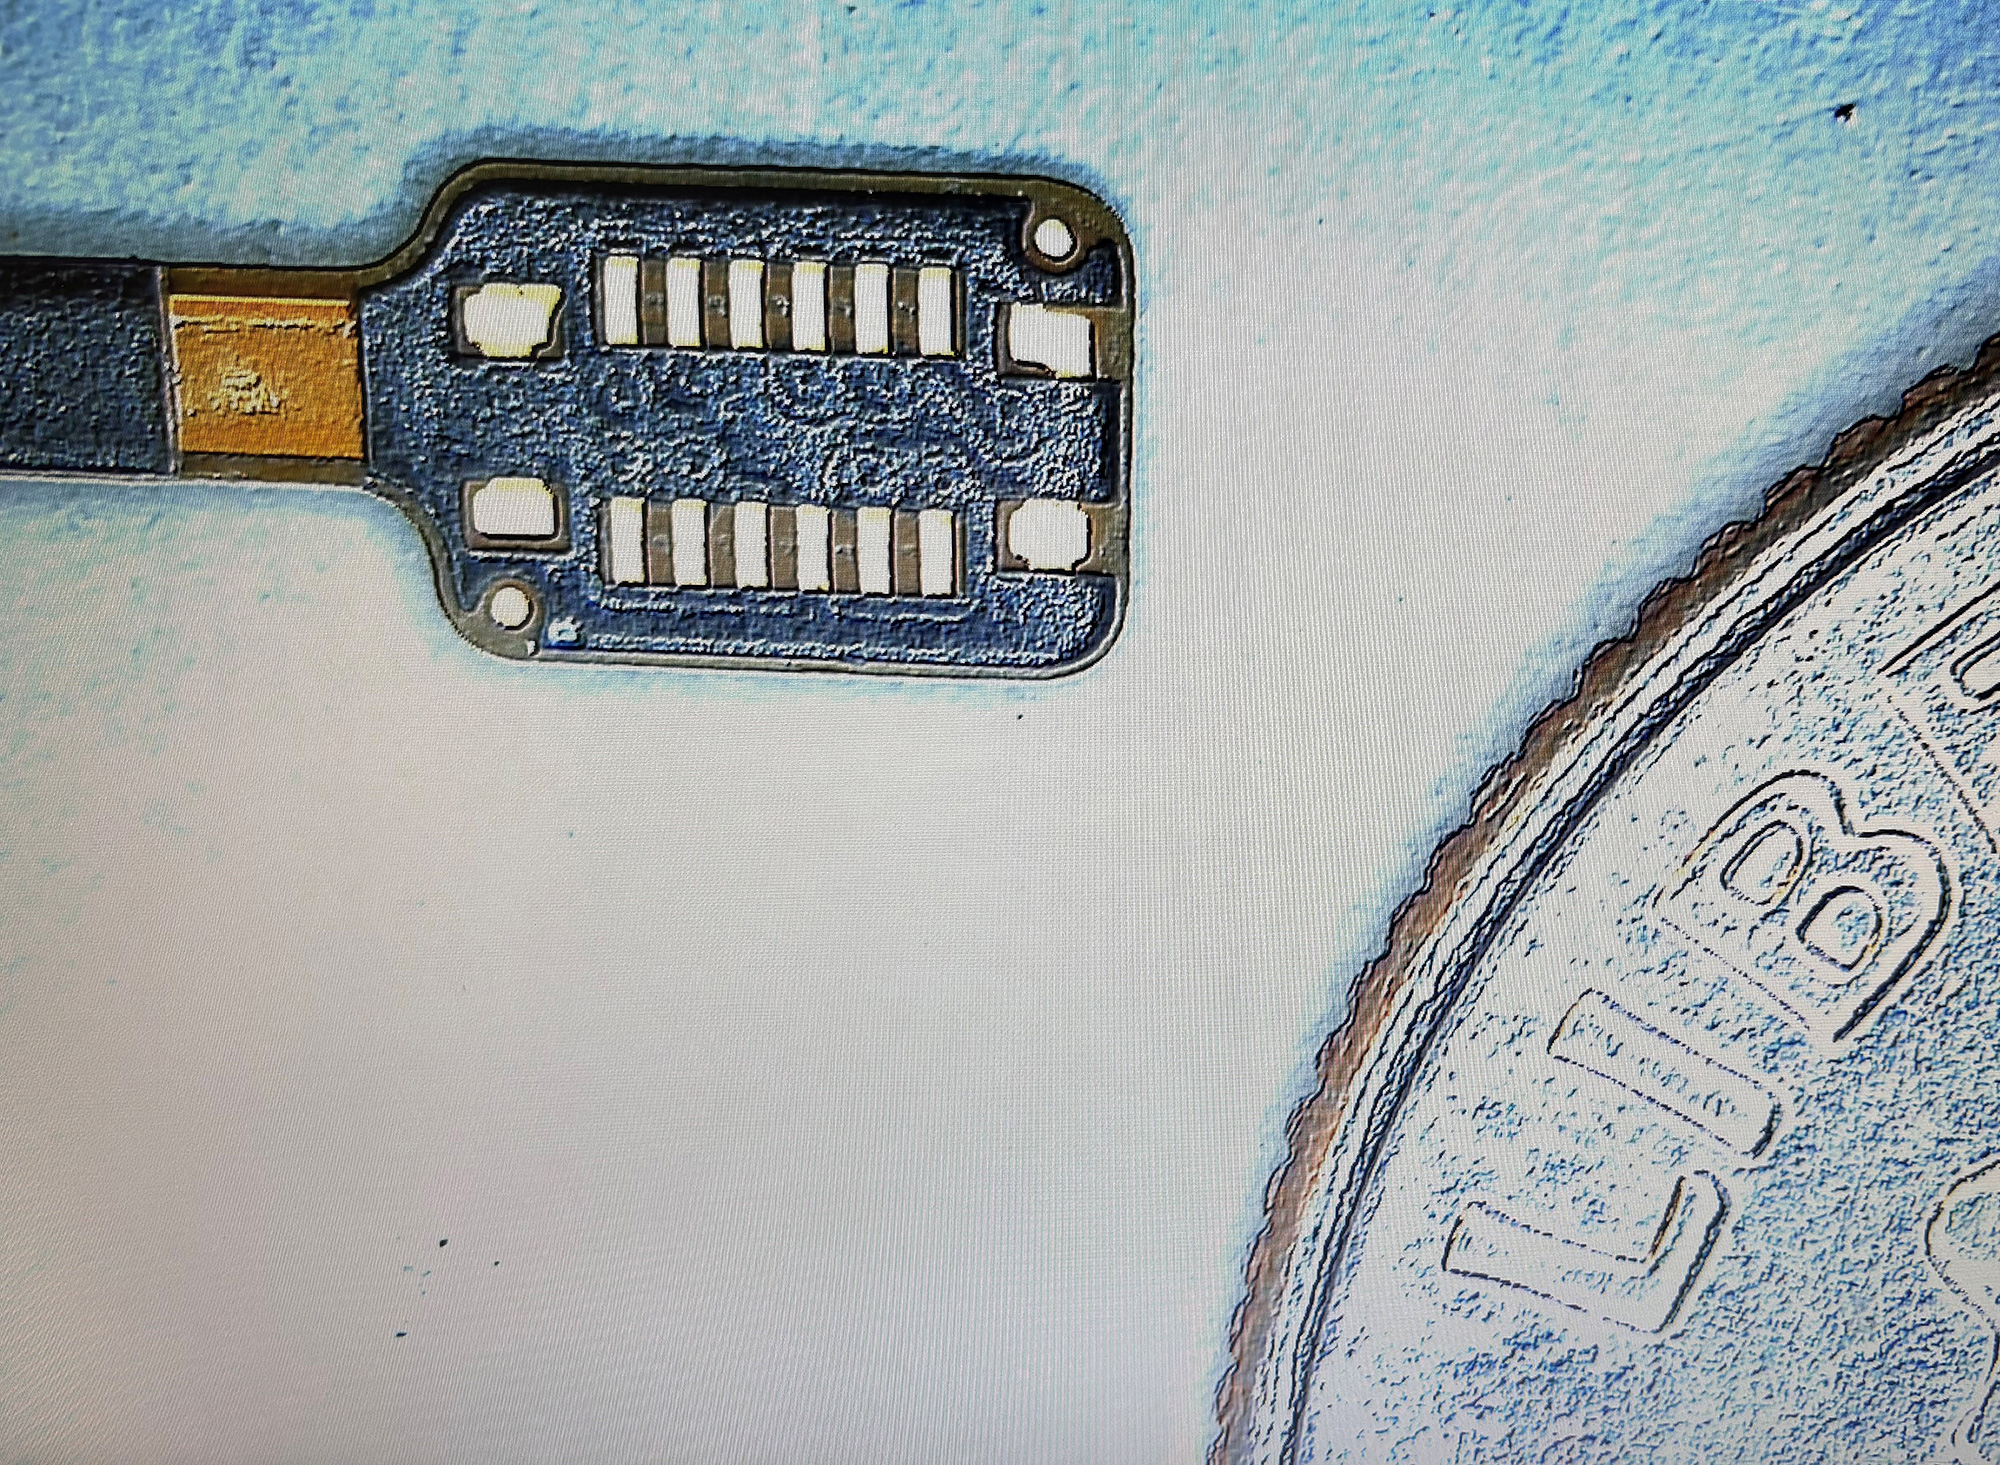
Tight spacing (less than 8 mils) between drilled holes and copper traces increases fabrication complexity and yield risk.
In the world of PCB manufacturing, knowledge of manufacturing constraints can help you design PCB using techniques that can guarantee reliable, economical and high-yield manufacturing. A wrong approach at the PCB layout stage can impact the complexity and cost of its fab and assembly. Understanding this enables you to develop smart practical design solutions for economical manufacturing and rapid prototyping cycles.