But is what they are designing getting more complicated?
We’ve often discussed the growing need for young PCB designers to fill gaps in an industry where it seems more than half of its workers will retire in the next decade. That much is clear now, so instead of focusing on what is already well-known, we can instead point to an alternative gleaned from the 2018 designers’ salary survey: the technologies they are asked to design.
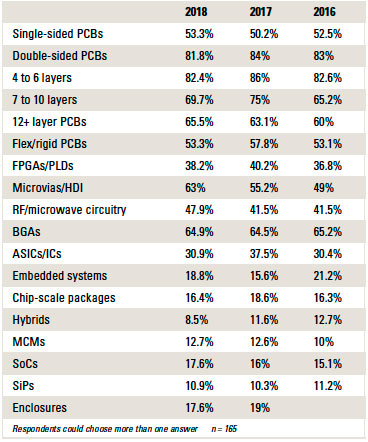
As for technology, while boards are often noted for their increasing density and smaller sizes, keeping layer count down appears to be a priority. More than half of the respondents to this year’s survey indicated they continue to design single-sided boards. And more than 80% are designing double-sided PCBs. At the same time, use of microvias/HDI is growing, as is RF/microwave circuitry. Perhaps surprisingly, only 16% indicated they use chip-scale packages. (Please note this survey is meant to be a snapshot, not a statistical be-all-end-all.)
We also added one new question to the latest survey: the percentage of time each week designers devote to actual design. For almost one-fifth of the respondents, board design is all they do. Another two-fifths spend more than three-quarters of their on-the-clock time at the CAD machine. Only 10% said board design takes up less than half of their business hours.
PRINTED CIRCUIT DESIGN & FAB conducted its annual designers’ salary survey in the last quarter of 2018, receiving 165 qualified responses from bare board designers, managers and design engineers. Data compiled included job titles and functions, ages, years of experience, education, location, types of projects, annual salaries and sales, job satisfaction and challenges, ECAD tools used, and years left in the field, among other data.
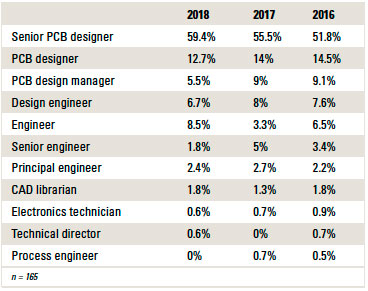
Job titles. Of the 165 respondents, the titles broke down as follows: 59% said they are senior PCB designers, 13% PCB designers, and 19% engineers. The remainder were PCB design managers or librarians (TABLE 1).
Table 1. Respondents by Job Title
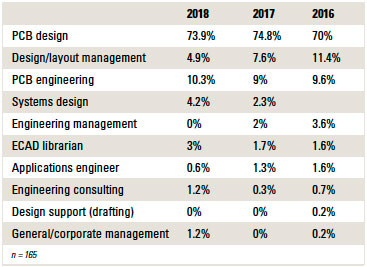
PCB design represents 74% of respondents’ principal job functions, including schematic, layout, placement, etc. (TABLE 2). Another 10% said PCB engineering is their principal job function. Design/layout management came in at 5%, and systems design made up 4% of responses.
Table 2. Principal Job Functions
Almost 91% said they have the same job as 2017, compared to 95% of respondents on the previous survey. Only 2% said they have been laid off in the past year.
Experience. Asked about their experience in the field, 39% said more than 30 years (FIGURE 1). Another 33% indicated 21 to 30 years of experience. Some 12% have 16 to 20 years of experience, while 7% have six to 10 years under their belts. Less than 7% of respondents have only one to five years of experience.
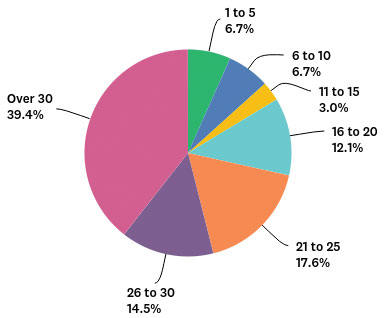
Figure 1. Years of experience.
For the second time, PCD&F asked respondents how many more years they plan to work as a designer. More than half plan to leave the field within the next 10 years. That’s a consistent response with last year’s survey. Another 22% said they plan to work as a designer for 11 to 15 more years. Fewer than a quarter of respondents said they plan to work in the industry for 16 or more years.
The over-50 crowd continues to make up the majority of respondents. Some 62% are between the ages of 51 and 70. Another 18% are between 41 and 50. Less than 10% were 35 or younger. Also, 88% of those who took the survey are male.
As with the previous survey, job satisfaction is high, with 89% of respondents offering a rating of 5 or more on a scale where 7 equals completely satisfied. Only 7% expressed dissatisfaction (ratings of 3, 2 or 1).
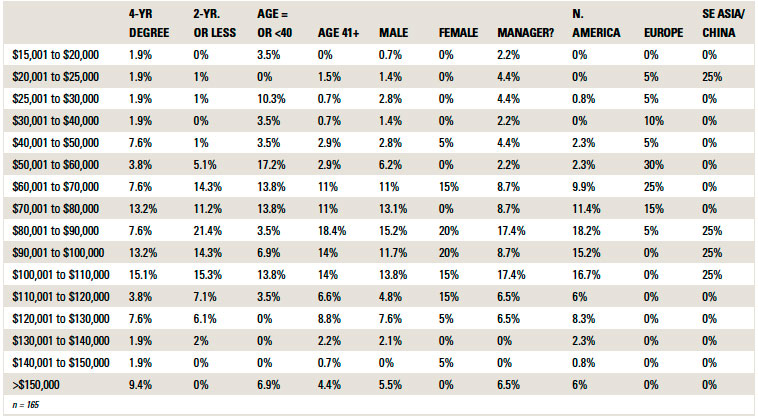
Salaries. Nearly one in five respondents (18%) make more than $110,000 a year in salary (TABLE 3). More than half (55%) said their salary falls between $70,001 and $110,000. Another 18% of designers’ salaries fall between $50,001 and $70,000. Less than 9% make $50,000 or less.
Table 3. Average Annual Salary, by Segment
For the second year, designers were asked if they are at or above their company’s salary range for their job/position, with 57% saying “yes.”
More than half of designers said they receive an annual bonus (53%). Of those who do, 43% said it is between 1 to 3% of their annual salary. Another 30% said their bonus comprises 4 to 7%, and 27% said they receive bonuses of more than 7%.
According to survey results, in the last year, salaries have risen 1 to 3% for half of respondents. Some 15% said their salary rose 4 to 6% during 2018. Six percent of respondents said their salary rose 7 to 10%, and 8% said it rose more than 10%. Another 20% said their salary hasn’t changed.
Education and benefits. Respondents were asked about their companies’ educational opportunities and benefits. Some 60% said they have the opportunity for on-the-job training. Forty-nine percent of companies provide tuition reimbursement, and 47% support classes at conferences. Some 39% of respondents claim the ability to attend company-sponsored classes, and 38% of the firms have mentoring programs. About 16% of companies back college classes.
Once again, health insurance topped the list of benefits offered, with 86% of responses. Some 75% of respondents’ firms offer dental insurance. Other benefits include:
- 401(k): 71%
- Life insurance: 69%
- Telecommuting: 32%
- Stock purchasing: 25%
- Company pension or retirement plan: 22%
- Profit sharing: 21%
- Sabbatical: 6%
- Daycare facilities: 4%
A majority of survey respondents said their benefits haven’t changed in the past year (58%). Another 12% said they have more benefits, or the same at a lower cost, and 30% either have fewer benefits, or their benefits costs are higher than before.
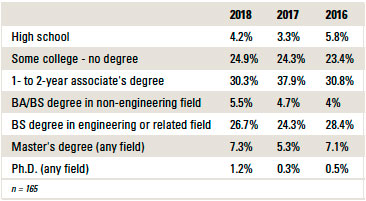
Education. The vast majority of respondents have some level of college experience – almost nine of 10 surveyed. Thirty percent of respondents have an associate’s degree, 27% have a bachelor’s in engineering or a related field, 7% have a master’s, and 25% attended college but did not graduate (TABLE 4). For those with degrees from four-year universities, two-thirds are in electrical engineering, and 12% in some other engineering field.
Table 4. Highest Level of Education
Certifications. In the 2018 survey, 37% of respondents said they are IPC certified designers. Of that segment, 55% are CID and 45% are CID+.
Companies. Some 67% of designers work for OEMs, according to survey results (FIGURE 2). Another 15% work for a design service bureau, and 7% work for a company that is both an OEM and design service bureau. Six percent are “consultant/academia/instructor/other.”
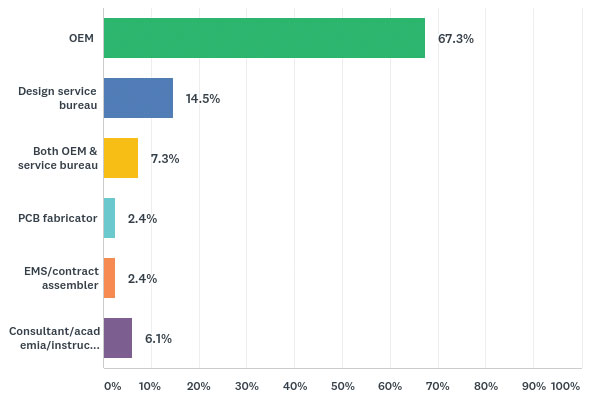
Figure 2. Company type.
On average, 27% of designers produce six to 10 new designs annually. Another 20% produce 11 to 15 new designs each year, and 17% produce 1 to 5. Nearly 15% said they produce 16 to 20 new designs in a 12-month span. According to responses, 13% produce more than 20 new designs annually.
Designers said they primarily design for these end-markets:
- Government/military/aerospace/avionics/marine/space: 32%
- Industrial controls/equipment/robotics: 14%
- Communications/related systems equipment (includes all phone types): 13%
- Medical/optical electronics and equipment: 10%
- Consumer electronics (includes wearables and white goods): 7%
- Computers/peripherals: 7%
- Electronic instruments/ATE design and test: 4%
- Semiconductors and related packaging: 4%
- Automotive/other ground vehicles: 3%
- Other: 6%
Table 5. Projects and Technology Trends
Challenges. Designers are more concerned about workload than keeping their jobs, as is evident when asked what their biggest challenges will be in 2019. They selected all that apply:
- Workload: 61%
- Technology: 36%
- Outsourcing: 20%
- Finding/keeping job: 19%
Software. On a weekly basis, Altium Designer tops the list of most utilized ECAD tools, according to the recent survey, with 32% of responses. Mentor Xpedition and Cadence Allegro were neck and neck with 30% of responses each, and Mentor Pads came in third, with 23%. Nineteen percent of designers said they use Cadence OrCAD on a weekly basis, making Mentor’s three platforms, including Mentor Board Station, the most used weekly software overall (57%), up from 50% in 2017.
When asked which ECAD tools designers use at least once a year, 32% said Altium Designer. The Mentor tools totaled 62%, led by Xpedition at 27%. Cadence tools made up 50%. Zuken tools combined for 7%. Autodesk Eagle was at 6%.
A correlation could be made between software used and respondents’ location. With most of the responses coming from the United States, that may have determined why Zuken products didn’t receive a higher percentage of responses, as Zuken is more popular outside the US, according to information provided at their annual user conferences.
To view the 2017 salary survey to compare with 2018 results, visit pcdandf.com/pcdesign/index.php/editorial/menu-features/11908-salary-survey-1708.
Chelsey Drysdale is senior editor of PCD&F/Circuits Assembly; This email address is being protected from spambots. You need JavaScript enabled to view it..


