The decisions made in the design seat determine not only the size and shape of the PCB, but also the technology and materials needed to build it.
The economy may be in a stall, but designers’ salaries still buck the trend. Last month, we asked designers to once again participate in our annual salary survey. The response was great, up over 30% from last year. Thank you to everyone who participated. The 2008 salary survey represents the input from over 300 designers who answered a very detailed questionnaire that related to their job, salary, benefits and education. It also provided the opportunity to voice what they see as the biggest challenges for 2009.
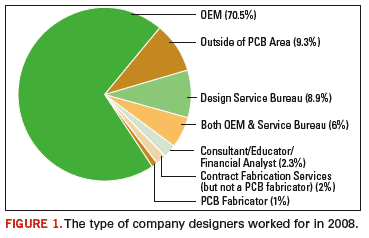
As in previous years, the majority of designers who responded to the survey work for an OEM company (FIGURE 1). The OEM designers represented 70.5% of the respondents. The next largest category included designers who work outside of the traditional PCB design companies, including semiconductor and packaging designers, at 9.3%. Service bureau designers represented 8.9% of the respondents.
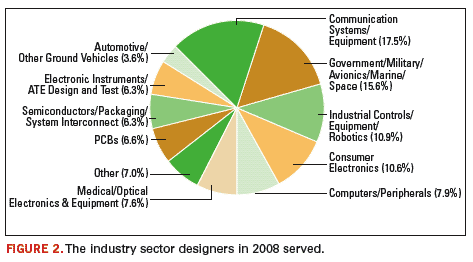
The top three end product segments worked on by these designers were in the areas of communications systems/equipment (17.5%), government/military/avionics/marine/space (15.6%) and industrial controls/equipment/robotics (10.9%). Overall the end products designed by the salary survey participants represented a good cross section of the electronics industry, as seen in FIGURE 2.
The annual base salary for designers working in the US increased in 2008, 3.2% over 2007 figures. Designers working outside of the US also saw their salaries increase. The average base salary for designers is highlighted in TABLE 1. Men working in the US, who comprised 86.1% of the respondents, made on average $4920.00 more in total salary than their female counterparts. Many of the designers indicated that they received an annual bonus. The average annual bonus in the US was 6% of the base salary. The bonus was substantially higher in non-US locations, contributing 8.9% to the total salary.
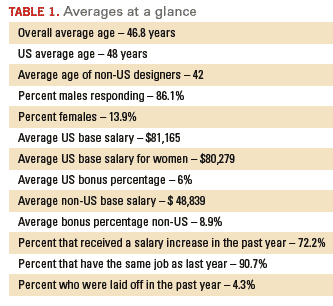
A majority of respondents received a raise in 2008, with 72.2% of the designers indicating that they received a raise. Employment was more stable than for previous years. Only 4.3% of the designers surveyed had experienced a layoff in 2008, down from the 5.2% seen in 2007. (Table 1)
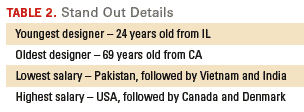
The average age of designers in the US did not advance this year, indicating there may be more young engineers entering the workforce. For the past few years, the average age of our survey respondents advanced by 1 year, indicating an aging designer pool. For the first time in years, this trend appears to be reversing, with a notable number of new, young engineers and designers pursuing PCB design / engineering as a career. For 2008, the average age for US survey respondents was 48 years old, the same as in 2007. The youngest designer was 24 years old and hailed from IL; and the oldest, from CA, was 69 years old (TABLE 2).
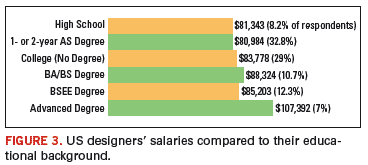
One of the trends we follow each year is the impact of education on salary. This year, advanced degrees, including MSEE, MBA and PhDs, played a big role in increasing the average salary of these degree recipients. For the first time, BS/BA recipients had higher salaries than their BSEE counterparts, earning $88,324 on average in the US, up $3,122 over the BSEE degree holders (FIGURE 3). The salary range across educational backgrounds from high school diploma only through a bachelor degree was very tight. Designers with no college education earned slightly more than the US average, $81,342 and more than their AS-degreed counterparts in this survey. Years on the job played a bigger role in the salary than did education, until we looked at advanced degree. US designers with an advanced degree had an average salary of $107,391, more than 30% higher than the US average salary without the advanced degree.
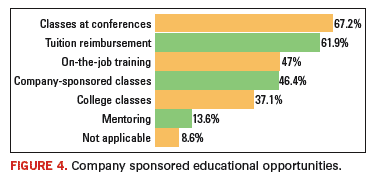
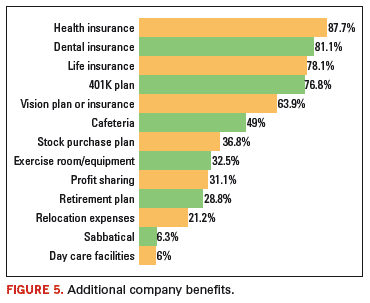
Most companies support continuing designer education through conference attendance and tuition reimbursement. Over 60% of the respondents (FIGURE 4) said the company they work for supports these types of educational opportunities. Going hand-in-hand with supporting education, most of the designers who participated indicated they had excellent benefit programs (FIGURE 5) including health and dental insurance (> 80%) and life insurance and 401K plans (> 75%). US designers unanimously noted the companies they work for offer health insurance.
The technology that designers are working on is advancing rapidly. FIGURE 6 shows a comparison of the types of technologies that 2007 designers where using compared to the 2008 reported technology levels. Many of the advanced technologies showed significant growth. Most notable include BGA usage, up nearly 17% compared to 2007. BGAs were used by 61.3% of the respondents in their 2008 designs. The HDI/microvia category was up 11.2 % to a usage rate of 45.7% with still less than 50% of designers actively engaged in the use of microvias in their designs in 2008. The co-design areas of FPGA, ASIC, ICs and packaging all experienced significant increased usage. Embedded systems were up 91% to a usage rate of 14.9% and had the highest technology usage gain for the year.
[ Click to see Figure 6. ]
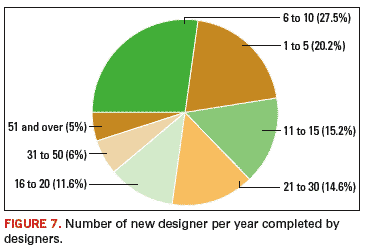
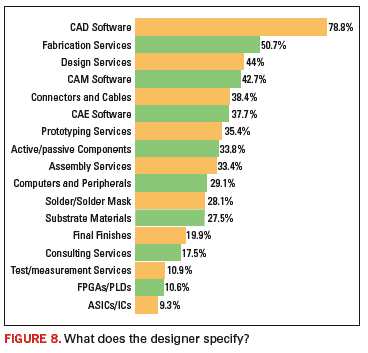
Designers were busy in 2008. Over 25% of them worked on six to 10 designs during the course of the year. Another 15.2% worked on 11 to 15 designs, and 37.2% worked on over 15 designs. Twenty percent (FIGURE 7) worked on only one to five designs over the course of the year. When asked about the products and services they directly specify, 78.8% included CAD software (FIGURE 8). Roughly 50% of the designers specified PCB fabrication services and half of these further specified the substrate materials, solder mask and final finish on these products. Over 30% specified components, assembly services, connectors and cables.
It seems that PCB designers control a sizable portion of the electronic supply chain. The decisions made in the design seat determine not only the size and shape of the PCB and what components will be needed in the BOM, but often determines what fabrication and assembly company will be selected to build the board, as well as what processes and materials will be use. Designers control technology introduction as well, by either embracing new techniques or holding off on technology integration in their products. A careful review of the types of technologies that designers are activity incorporating into their designs can provide useful information on the requirements for next generation products and processes throughout the supply chain. PCD&F
Kathy Nargi-Toth is editor for Printed Circuit Design & Fab magazine and can be reached at knargitoth@
upmediagroup.com.


