Unlocking the electrical performance of an interconnect may be as simple as mastering the S-parameter.
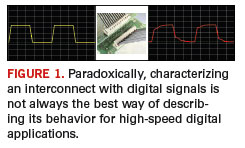
The fastest way to an answer is not always the direct path. When it comes to characterizing the electrical performance of an interconnect, like a connector, package, interposer or backplane channel, looking at its impact on digital signals is not the most efficient way of describing its high speed digital performance. You may see how it behaves for one specific application, but it is difficult to extend this to other high-speed digital signals (Figure 1).
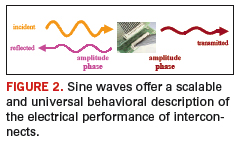
The solution is to borrow an approach used in the RF world: that is, to use the interactions of precision sine wave signals with the connector to characterize its performance. While this seems like a step backward for digital applications, it provides a simple, reproducible and general process that has swept the signal integrity world by storm over the last five years to become the de-facto standard in gigabit-per-second applications.
In the frequency domain, all signals are sine waves with an amplitude and phase. Describing the electrical properties of a connector in terms of how sine waves interact with it, as seen in Figure 2, means using the changes in the magnitude and phase of the sine wave as it interacts or “scatters” off the connector.
Historically, when sine waves scatter off an interconnect, their response is called the Scattering Parameters, or S-Parameters. All the information pertaining to the behavior of an interconnect is contained in its S-Parameters. Because the S-Parameters of a connector can be used to predict the complete behavior of a connector in a system, the S-Parameters can also be called behavioral models.
A port is the connection to the device, and it has a signal and return path, which in its most common form, is a coax connection. When a sine wave is launched into the port to simulate or measure the S-Parameters, by definition, it must be in a 50-Ohm environment. The S-Parameters are a measure of the sine waves that scattered off the device, either reflecting back from the incident port or scattering into any other ports that might be connected.
If a sine wave enters a port, there are only three qualities of it that can change when it comes out again; its frequency, amplitude or phase could be affected. For all linear, passive interconnects, which includes all interconnects except those with ferrites, the frequency of the sine wave coming out will always be exactly the same as the frequency of the sine wave that has entered. That leaves the changes in the amplitude and the phase that will be recorded as the S-Parameters.
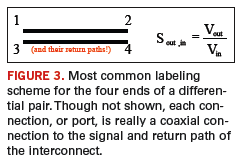
A typical device used in high-speed applications will be part of a differential channel with four connections on the ends. To distinguish which port we are discussing, each is labeled with an index number (Figure 3). Port 1 is an input that feeds to Port 2, with Port 3, adjacent to Port 1, feeding into Port 4.
When a sine wave goes into Port 1, it can do a number of things. It can scatter, reflect back through Port 1 or it can be scattered out one of the other Ports (2, 3 or 4). The ratio of the sine wave coming out to the sine wave going in, at each frequency, is the S-Parameters.
With four ports, there are 16 possible combinations (Figure 4) of sine wave going ins and coming outs. This makes it essential to use the port index numbers to keep track of each S-Parameter. By convention, the index labels are in reverse order of the going in and coming out order. S21 refers to the sine wave going in at Port 1 and coming out at Port 2. This would be the transmitted signal in one line of the differential pair, also called the insertion loss.
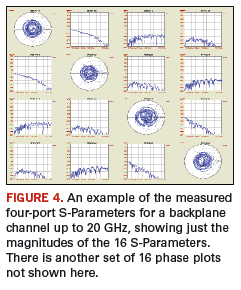
All 16 combinations of S-Parameters can be tracked in a simple 4 x 4 matrix. Each S-Parameter will have a magnitude and phase at each frequency measured. Because this is an enormous amount of information, it is important to use the formalism to describe the S-Parameters in order to manage the information contained in the S-Parameters.
Each S-Parameter matrix element, between its magnitude and phase, explains a piece of the behavior of the interconnect. Even though these S-Parameters might have been measured or simulated as the single ended behavior of the channel, with a little manipulation of the terms, they can be converted into the differential S-Parameters, that describe the behavior of differential and common signals on the interconnect.
If we have the behavior in the frequency domain, we can use a little algebra to convert this into the time domain which would look similar to the traditional TDR and TDT response of the interconnect seen in Figure 5.
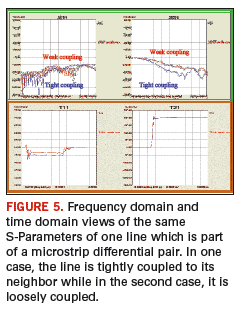
Even though the performance of the connector might be measured as the single ended response in the frequency domain, it can be converted into the differential response in the time domain. The information is embedded in the original S-Parameters. It is just with a little algebra that it can be re-displayed.
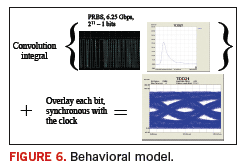
One format that it can be converted into is the impulse response. If we know the impulse response of an interconnect, sometimes called the Green’s Function, we can use this as a behavioral model to predict how any arbitrary, time domain signal might interact with the interconnect. This behavioral model (Figure 6) is a surrogate for the actual connector.
In a four-port device, measured from 10 MHz to 20 GHz, if the magnitude and phase, the single-ended and differential, the frequency domain and the step and impulse time domain responses are included, there are over 100,000 individual data elements. The S-Parameter formalism, borrowed from the RF world, has become a simple, compact way of manipulating and interpreting this wealth of information.
Everything you ever wanted to know about the electrical performance of an interconnect is contained in these S-Parameters. By mastering S-Parameters, you can master high-speed electrical performance. PCD&F
Dr. Eric Bogatin, signal integrity evangelist can be reached at This email address is being protected from spambots. You need JavaScript enabled to view it.. For additional information on this and other signal integrity topics go to www.beTheSignal.com.


