Stackup analysis can help to optimize layer count, trace width and spacing and electrical performance.
Part 1 appeared in the October issue. Part 2 appeared in the December issue. All three parts are presented here.
The term “stack-up” refers to the arrangement and the types of layers in a multilayer board. The design of a PCB stack-up involves ascertaining the number of signal layers1 needed to route the board and the ground/power planes demanded for adequate power distribution. It is recommended that the layers are arranged so that each high-speed trace is referenced to a continuous plane2. Furthermore, it is desirable for the stack-up to include parallel (adjacent) power and ground layers for enhancing capacitive decoupling and reducing EMI, and the PCB stack-up will strongly influence impedance of a power distribution system (PDS).
Prepreg (also called B-stage) consists of a glass cloth coated with resin (epoxy) that has not been fully cured. A prepreg layer is applied between two internal layers (or cores) of a multilayer PCB to function as glue through the lamination process. A core is a thin piece of dielectric (cured fiberglass-epoxy resin) with copper foil bonded on both sides. The term laminate also refers to a composition of two sheets of copper foil laminated to a piece of woven glass cloth saturated with resin and fully cured.
The thickness of the copper foil is expressed in ounces3 that represent the weight of copper per square foot of surface area. Three common thicknesses are 0.5 ounce, 1.0 ounce and 2.0 ounce. Copper foil of 1.0 ounce (~1.4 mils) thickness is produced by plating to a thickness sufficient to equal one ounce of copper distributed over a one-square-foot area.
Use of 1.0 ounce copper foil is quite popular in PCB fabrication; however, 0.5 ounce ground/power planes can be sufficient for all high-speed PCBs with exception of those that demand very high power levels. Copper foil that is categorized as 1.0 ounce foil has a thickness of approximately 1.2 mils and 0.5 ounce foil has a thickness of 0.6 mils in the completed circuit board because of of anticipated copper losses that result from the chemical processes used in the manufacturing process. The thickness of plane ground and power layers adds to the total PCB thickness.
Standard PCB thickness values4 include 39 mils, 62 mils, 93 mils and 125 mils, but other board thicknesses (for instance 100 mils) can be also obtained. Stack-up parameters such as spacing between layers, substrate dielectric materials and trace dimensions need to be selected properly in order to meet the board impedance and crosstalk requirements.
Several stack-up features can be illustrated by considering a four-layer PCB, as depicted by Figure 1.

Ground and power planes perform multiple functions, one of which is to distribute power to various devices, but they also furnish a means for achieving controlled impedance transmission lines. The plane layers can appreciably diminish noise and radiation levels. At frequencies5 exceeding 10 MHz or 15 MHz, incorporation of power and ground layers, such as a multilayer stack-up as opposed to a two-layer board is recommended.
In Figure 1, the layer order from top to bottom is Sig, Gnd, Pwr and Sig, which implies that the outer layers are formed by the signal layers, and the inner layers are the ground and power. Another possibility is to have ground and power plane layers as outer layers (Gnd, Sig, Sig, Pwr). This scheme can provide greater shielding6, but it is accompanied by several drawbacks. For example, the planes need to be cut to allow component placement, and rework on the board becomes more difficult.
The stack-up depicted by Figure 1 is a common arrangement for a four-layer PCB; the parallel power and ground planes can furnish interplane capacitance3 which is important in the stack-up design of high-speed PCBs.
The capacitance produced by a parallel plate capacitor is directly proportional to the area of plates and inversely proportional to their separation7. In Figure 2, Mathcad is applied to compute and to plot interplane capacitance (per unit area) for two different dielectric materials. These include Isola 370HR (in red) and Rogers 4320 (in blue). The Isola 370HR material is a high performance 180ºC glass transition temperature (Tg) system for PCB applications where maximum thermal performance and reliability are entailed.

Rogers 4320 (prepreg) and 4350 (laminate) are glass-reinforced8 ceramic thermosets that are available in several thicknesses with dielectric constant εr = 3.5 and loss tangent Tan(δ) = 0.004. In general, Rogers RO4000 series9 are low-loss materials that can be economically fabricated via standard epoxy/glass processes. They are designed with excellent high frequency performance and low cost circuit production in mind.
The capacitance resulting from two adjacent plane layers plays a crucial role in the power delivery system (PDS) of high-speed boards. Since such parallel plate capacitance is inversely related to the separation of the plane pairs, it is desirable to keep the planes near each other. However, there are two important limitations3 concerning how close the planes can be fabricated. These restrictions relate to the capability of PCB manufacturer to laminate the planes without causing shorts and to preserve minimum dielectric thickness to meet insulation standards.
Normally, PCBs cannot provide adequate interplane capacitance5 to successfully meet decoupling requirements below 500 MHz. When this occurs, other decoupling methods, such as employment of discrete capacitors, are then needed.
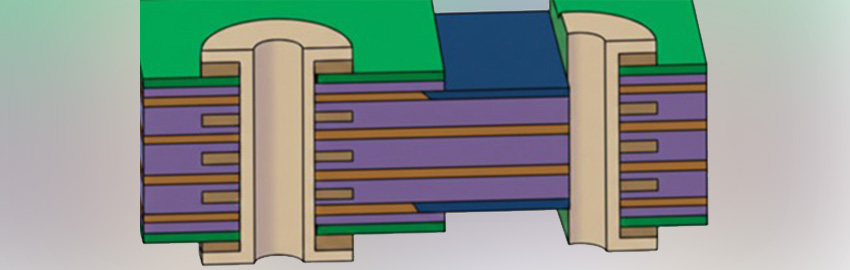
Let us consider the six-layer structure of Figure 3, which includes both outer (microstrip) and inner (stripline) traces. For a surface microstrip10 the signal conductor is exposed to air, so the effective dielectric constant will be somewhere between that of air (which equals 1) and the dielectric constant of the substrate below the trace. The signal speed is influenced by the effective dielectric constant with the surface microstrip usually offering the fastest propagation velocity10.

After plating, outer-layer traces have greater trace-width variation than innerlayer traces. This implies that stripline traces provide superior impedance control as compared to microstrip lines. However, striplines can cause stubs11 when through-hole vias are used, as illustrated by Figure 3.
The configurations depicted by Figures 3a and 3b (which involve connection to stripline traces) result in stubs due to unused via portions (the segments which extend past the vias’ last connecting layer). However, the case of Figure 3c, in which two microstrip transmission lines are connected, can shun via stub formation.
Bogatin12 presents an interesting comparison of microstrip vs. stripline traces in terms of impedance control, differential pair coupling, attenuation, far-end crosstalk and routing density. Generally, higher-density PCBs are less expensive, but closely spaced traces can result in crosstalk issues. The PCB manufacturing cost is directly related to the size of the PCB and the number of layers13.
When designing a PCB stackup, it is essential to consider crosstalk1 requirements. Depicted by FIGURE 4 are two single-ended traces having line width W, thickness t, edge-to-edge separation Sn and height over reference plane H. Er is the relative dielectric constant of the substrate.

In order to minimize crosstalk, it is desirable to set H as small and Sn as large as allowed by board target impedance and routing restrictions.14 The effect of these stackup parameters on crosstalk15 is disclosed by Equation 1 (FIGURE 5).

Lm is mutual inductance between two neighboring wires, H equals the thickness of the dielectric substrate and L is the line inductance. The center-to-center spacing (s) and edge-to-edge spacing (Sn) for two traces of width W are directly related as shown by Equation 2 (Figure 5).
Crosstalk requirements control trace separation (pitch), which in turn influences board density and the number of routing layers. From Equations 1 and 2, it follows that crosstalk noise (between two neighboring traces) being proportional to mutual inductance, decreases as Sn increases or H decreases. Optimizing trace separation is also valuable for controlling crosstalk between two coupled differential pairs, as illustrated in FIGURE 6.

Crosstalk between differential pairs 1 and 2 can be diminished by widening Sn. A study of far-end crosstalk (FEXT) and crosstalk-induced jitter involving two edge-coupled differential pairs of W = 5 mil and interapair separation Sp = 5 mil, revealed that increasing the pair-to-pair spacing Sn from 5 mils to 20 mils can significantly reduce FEXT16 and deterministic jitter (DJ). Other measures to avoid crosstalk problems include minimizing parallel run lengths, incorporating guard traces15 and orthogonally routing the signal lines which belong to adjacent routing layers.
To attain good signal integrity, a clean15 unobstructed return path is demanded for high-speed signals. Signal and power quality degradation can occur in PCBs and IC packages due to high-speed traces traversing17 plane-splits.
Plane layers fulfill several duties in power distribution networks (PDNs). They can transfer DC current from source to load, connect bypass capacitors to active components and furnish a return path18 for the signals. Current flows on power distribution in a manner to diminish total impedance.19 At low frequencies, this translates to minimizing resistance by spreading20 over every possible path. At high frequencies, the return current crowds under the signal (on reference plane) to minimize inductance.
It is important to avoid splits on ground or power planes, but there are situations when it is inevitable.20 For instance, power islands and moats arise when multiple powers are incorporated on the same plane. Sometimes, it is necessary to allow a plane layer cut-out beneath a connector21 in order to lessen the mounting pad capacitance.
Under such circumstances, when cutouts on reference planes are unavoidable, it is critical not to route high-speed buses over such voids (unless the plane with slots is sandwiched between two uniform/continuous planes).
The return current path is also interrupted whenever a signal transitions from one layer to another and changes reference planes. It is then desirable to place near the signal via22 another via (if both reference planes are of same type) or a decoupling capacitor (if one reference plane is a ground while the other one is power). This can furnish for the return current a high-frequency lane between the two reference planes.
Thickness of metal (i.e. plane and signal) layers is a significant option when constructing PCB stackup. Thicker cladding offers lower resistance and symbolizes a good selection for power planes19. Thinner cladding sustains narrow lines with superior width control; hence, thin cladding is often a logical preference for signal layers to achieve high density routing.
Utilizing 0.5 oz copper for signal layers is a good choice for impedance control3 since only a very small amount of etching is necessary to produce a trace. This allows controlling the trace width to within +/- 0.5 mils. However, there are also cases in which thicker traces are desired in order to decrease the trace’s DC resistance (or for realizing superior thermal performance), although it is more difficult to attain impedance control for thicker traces.
Accomplishing impedance control for high-speed, single-ended signals (such as memory buses and CPU interfaces) and differential pairs (high-speed serial-links, differential clocks, etc.) is vital in stackup design.
Mathematical equations exist for calculating single-ended and differential impedance23. These formulas offer useful insight regarding how impedance depends on various stackup parameters (e.g., dielectric constant, trace width, dielectric thickness). For instance, Equation 3 (Figure 5) which is an IPC recommended23 approximation for microstrip impedance, reveals that Zo decreases as the dielectric constant (Er) increases, copper thickness (t) increases or trace width (W) increases. Furthermore, Zo increases as dielectric height H increases. Equation 4 (Figure 5), which applies to edge-coupled microstrip using FR4 material23, illustrates that differential impedance Zdiff is a function of Zo (the uncoupled single-ended characteristic impedance for each trace), edge-to-edge separation between traces Sn and dielectric thickness H.
Impedance formulas can provide helpful insight and more precise results than rules of thumb approximations, but the accuracy of such analytical techniques is usually limited to about 10%. Ascertaining impedance to a higher degree of exactness would require the use of a field solver program.
Whenever a PCB undergoes modifications, it is necessary to perform stackup analysis24. Such assessment considers optimum number of layers, board size, routing density, copper weight, power needs, PCB thickness, dielectric materials, trace widths/separation, most favorable impedance, price and manufacturability.
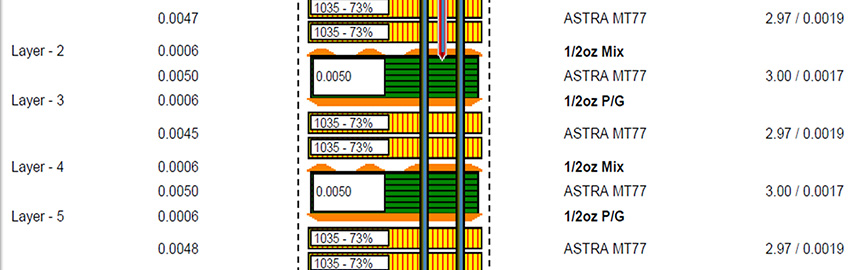
Application of HyperLynx Stackup Editor for impedance planning is illustrated by FIGURE 7. The Stackup Editor allows adding or subtracting layers and incorporating soldermask.

For each dielectric, it permits selecting technology (prepreg or core), thickness, dielectric constant and loss tangent. For metal layers, it allows defining metal type (for correct resistivity and temperature coefficient). Trace widths and thickness can be specified for each signal layer. The Zo Planning tab allows for specifying target impedance (for single-ended or differential pairs) and then solving for various parameters (trace width, separation).
Figure 7 shows a stackup consisting of eight layers. An eight-layer stack5 can satisfy several desirable requirements, including multiple ground and power layers. In this case each signal layer is adjacent to a tightly coupled plane layer, and the signal layers are located between planes layers (and are thereby being well shielded).
In order to minimize warping, it is desirable for the stackup to be symmetrical and well balanced25. Normally, an N-layer PCB includes N metal layers separated by N-1 dielectrics, and N should be an even number to avoid warpage19.
Another measure to accomplish uniformity is to add dummy copper pads (thieving) to open areas on the PCB’s outer layers. This aids in attaining a uniform copper distribution across the whole board surface.
Pouring copper on outer layers and grounding it with multiple vias can enhance shielding, reduce crosstalk and improve heat dissipation.26 Furthermore, copper/ground flooding (not to be confused with thieving, which involves applying dummy copper pads) influences impedance and can convert mictrostrip lines into coplanar configuration. Such geometries can be efficiently analyzed with Polar Instruments’ Si8000 software27 that employs Boundary Element Modeling to forecast the finished impedance of various PCB structures.
FIGURE 8 exemplifies impedance computation for a coplanar differential pair.

The parameters comprise trace width = 12 mil, trace thickness = 2 mil, dielectric thickness = 8 mil, dielectric constant = 3.38, intrapair separation = 15 mil, line to ground clearance (horizontal) = 10 mil, solder mask thickness = 0.8 mil and solder mask dielectric constant = 4.5. Si8000 predicts differential impedance of 100.43 Ω. This denotes a nominal calculation, but frequently it is necessary to consider impedance tolerances.
A typical tolerance value is +/- 10%. A differential impedance of 100 +/- 10% implies variation from 90 Ω to 110 Ω. Sometimes, it is desirable to have a tighter tolerance such as +/- 5%, since impedance tolerance often involves trade-off between impedance of PCB traces, package, driver output impedance and termination resistors. Tightening the PCB trace tolerance makes it feasible to relax the constraints on other parameters (package, driver, termination), but this also increases board fabrication cost. A 5% tolerance is more expensive to manufacture than a 10% tolerance, which is costlier than a 15% tolerance.25
Three main materials3 in a multilayer PCB embrace copper foil sheets, resin and woven glass cloth. Cores or laminate sheets are constructed by affixing copper foil to one or both sides of fully cured prepreg sheets. Prepreg mats are a weave of glass fiber yarns preimpreganted28 with partially cured resin.
Several resin types are utilized for prepreg preparation. These resin systems usually differ in electrical properties (such as dielectric constant and loss tangent) and mechanical/thermal characteristics (coefficient of expansion, glass transition temperature and rate of moisture absorption).
The commonly used FR-4 has a woven glass/epoxy resin composition.
However, there are alternatives such as GETEK, MEGTRON, BT, polyamide28 and cyanate resin material, with attractive mechanical or electrical properties (low dielectric constant and loss tangent).
Fibers are applied to strengthen the resins; these comprise the electrical grade E glass and structural grade S glass. E glass is more common, but S glass is stronger and has lower Er (also more expensive) than E glass. Addition of fiber to resin alters the electrical and mechanical characteristics of the composite structure based on glass-to-resin ratio. FR-6 utilizes a polyester29 resin system plus glass matte reinforcement and is suitable for flame resistant30, low capacitance or high impact applications.
Solder mask / resist is a coating that protects PCB traces and prevents solder bridges and shorts. It facilitates wave soldering applied in mass assembly. Solder mask is a lacquer-like polymer layer often applied with a green tint, but it is available in various colors and finishes. A common solder mask31 is Liquid Photo Imagable (LPI).
For a multilayer PCB, the copper thickness does not have to be the same for all stackup layers. It is also unnecessary for all the cores to be of the same laminate. Hybrid-type construction has been gaining popularity. The PCB conductor and dielectric losses32 constitute another critical consideration.
The DC conductor resistance is governed by Equation 5. All of the Equations can be found in FIGURE 9. Here, Rdc represents resistance per unit length for DC currents, ρ is the bulk conductor resistivity33, W is trace width and t is thickness. The conductor DC losses are directly related to Rdc and are frequency independent.

DC losses are negligible for short traces of large crosssections and become important for long lines of small cross-sectional geometries and for multi-drop topologies. In Equation 6, Rac symbolizes the AC conductor resistance per unit length and δ is the skin depth. Rac can be reduced by widening the trace width. It varies inversely with δ and directly with √f. When ascertaining the total AC resistance, it is necessary to also account for resistance of return current on the reference plane. Furthermore, the conductor AC loss is directly related to Rac and hence proportional with the square root of frequency.
Equation 7 is a skin depth expression with σ being the conductor’s conductivity (inverse of resistivity ρ), μ0 is permeability of free space, μr is conductor’s relative permeability and f is sine-wave frequency. When f is in Hz, σ in Siemens/meter and μ0 in Henries/meter (4∏E-7), then Equation 7 produces ÏŒ in meter. Equation 8 is a simplified skin depth formula34 applicable to copper ( σ = 5.6E7 Siemens/m and μr =1), with fmhz being frequency in MHz and δcu in micron.
In Equation 9 αdiel represents attenuation associated with dielectric loss 32 in dB/in, fghz is frequency in GHz and Er is substrate dielectric constant.
FIGURE 10 presents dielectric loss - αdiel (based on Equation 9) for several materials, generated with the aid of Mathcad. The curve RO4 (Rogers 4350) displays the least and FR-6 the most attenuation in this comparison.

NeS (Nelco N4000-13SI), which utilizes S glass, is less lossy than NeE (Nelco N4000-6 Hi Tg FR4), based on E glass.
At high frequencies, for typical PCB trace dimensions, the dielectric losses being proportional to frequency can become dominant32 over conductor DC losses (frequency independent) and AC losses (proportional to √f ).
In addition to conductor and dielectric losses, the effects due to roughness of conductor surface can be significant. Conductor roughness is often expressed as tooth structure14 and the amount of surface variations is portrayed as tooth size. Conductor surface roughness can effectively increase the material resistance when the mean surface roughness is a significant percentage of skin depth. For instance, at a frequency of ~ 200 MHz, the skin depth of copper is 4.667 micron, which approximately equals the typical PCB surface roughness ( ~ 4 microns to 7 micron). Frequency harmonics exceeding 200 MHz will then deviate from the ideal loss formulae14. For producing low loss interconnects, it is desirable to have smooth copper foils.
Conclusion
When selecting PCB materials, some parameters that need to be considered include the conductor and dielectric losses, the electrical characteristics, the mechanical/thermal properties and the price.
There are other important contemplations involved when ascertaining optimum materials for PCB stackup, such as impact of glass weave35 in PCB laminates on Gigabit per second signals and also meeting standards (IPC specifications). These will be discussed in Part 4 of this article. PCD&F
ACKNOWLEDGEMENT
I am grateful to Messrs. Nanoo (Frederik) Staal, Mohammad Tabatabai, Afshin Momtaz, Matthew Isaacs and Neven Pischl of Broadcom Corporation, and Ms. Debi Sorensen of Mentor Graphics Corporation.
REFERENCES
1. Lee W. Ritchey, “Right the First Time, a Practical Handbook on High Speed PCB and System Design, Vol. 1”, Speeding Edge 2003, Pgs. 207 – 210.
2. Douglas Brooks, “Signal Integrity Issues and Printed Circuit Board Design,” Prentice Hall PTR, 2003, p. 307.
3. Lee W. Ritchey, “Right the First Time, a Practical Handbook on High Speed PCB and
System Design, Vol. 2,” Speeding Edge 2006, Pgs. 43-44, Pgs. 66-72.
4. Abe Riazi, “PCB Database Viewing for SI Analyses, Part 1,” Printed Circuit Design and Manufacture, August 2007, Pgs. 18-19.
5. Henry W. Ott, “PCB Stackup Part 1,” Henry Ott Consultants, 2000.
6. Henry W. Ott, “PCB Stackup Part 2,” Henry Ott Consultants, 2002.
7. John Ardizzoni, “A Practical Guide to High Speed Printed Circuit Board Layout,”
Analog Dialogue 39-09, September (2005).
8. Chad Morgan, “The Impact of PWB Construction on High-Speed Signals,” Technical Seminar, Amp Circuits and Design tyco electronic, 2000.
9. “RO4000 Series High Frequency Circuit Materials,” Data Sheet RO1.4000, Rogers Corporation 2003.
10. “Microstrip transmission line structures,” Polar Instruments Ltd, Application Note AP122.
11. Abe Riazi, “Via Modeling for High-Speed Simulations, Part 1,” Printed Circuit Design and Manufacture, September 2003, Pgs. 30-31.
12. Eric Bogatin, “Microstrip or Stripline?” Printed Circuit Design and Manufacture, February 2006.
13. “High Density Design With MicroStar BGAs,” Texas Instruments, Application Report SPRA471C-April 2003.
14. Stephen H. Hall, Garrett W. Hall and James A. McCall, “High-Speed Digital System Design, A Handbook of Interconnect Theory and Design Practices,” John Wiley and Sons, Inc., 2000, p. 68, pgs. 82-90, p. 115.
15. Ernie Buterbaugh, “Perfect Timing A design Guide for Clock Generation and Distribution,” Cypress Semiconductor Corporation, 2002, Chapter 6.
16. Greg Edlund, “Timing Analysis and Simulation for Signal Integrity Engineers,” Prentice Hall, 2007, pgs. 196-197.
17. Abe Riazi, “Effects of Plane Splits on High-Speed Signals, Part 2,” Printed Circuit Design & Manufacture, April 2007, pgs. 16-17.
18. Istvan Novak and Jason R. Miller, “Frequency-Domain Characterization of Power Distribution Networks,” Artech House Inc., 2007, p. 67.
19. Brian Young, “Digital Signal Integrity Modeling and Simulation with Interconnects and Packages,” Prentice Hall PTR, 2001, pgs. 410 - 413.
20. Abe Riazi, “Effects of Plane Splits on High-Speed Signals, Part 1,” Printed Circuit Design & Manufacture, February 2007, pgs. 16-17.
21. “Virtex-4 Power System Performance,” Xilinx Signal Integrity Seminar Series, March 28, 2006.
22. Henry W. Ott, “PCB Stack-Up Part 6,” Henry Ott Consultants, 2002.
23. Eric Bogatin, “Signal Integrity Simplified,” Prentice Hall PTR, 2004, p. 260, pgs. 489-490.
24. Chuck Troia. “Stackup Analysis Using HyperLynx,” IEEE SCV Chapter of the EMC Society, January 10, 2006.
25. Patrick Carrier, “Proactive High-Speed PCB Stackup Planning,” Mentor Graphics Webinar, 2004.
26. Gary Melchior, “LMH0034 PCB Layout Techniques,” National Semiconductor Application Note 1372, July 2006.
27. Eric Bogatin, “Board Stackup’s Important Tool,” Printed Circuit Design & Manufacture, December 2003, pgs. 18-20.
28. Stephen C. Thierauf, “High-Speed Circuit Board Signal Integrity,” Artech House, Inc., 2004, pgs. 2-9.
29. Clyde F. Coombs, Jr., “Printed Circuits Handbook, Fifth Edition,” McGraw Hill Handbooks, 2007, Chapter 5.
30. Helen Holder, “Introduction to Surface Mount Technology,” April 2002.
31. Al Williams, “Build Your Own Printed Circuit Board,” McGraw-Hill, 2004, p. 14, p. 168.
32. Abe Riazi, “Engineer’s rule of thumb simplifies PCB signal integrity,” EE Design, August 19, 2002.
33. “Calculating Track Resistance,” Polar Instruments Ltd., Application Note AP144.
34. Abe Riazi, “Maxwell’s Influence on Signal Integrity,” Printed Circuit Design & Fab, December 2007.
35. “PCB Dielectric Material Selection and Fiber Weave Effect on High-speed Channel Routing,” Altera Corporation, AN-528-1.0, May 2008.
DR. ABE (ABBAS) RIAZI is a senior staff scientist hardware development with Broadcom Corporation in Irvine, California. He can be reached at This email address is being protected from spambots. You need JavaScript enabled to view it..