Estimate the time constant of a process prior to conducting
the DOE to prevent erroneous results.
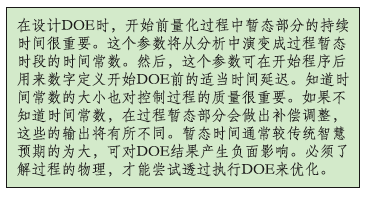
When designing a DOE it is important to quantify the duration of the
transient portion of the process before you begin. This parameter will
evolve from the analysis as a time constant for the transient phase of
the process. This parameter can then be used after starting the process
to numerically define the appropriate time delay before starting the
DOE. Knowing the magnitude of the time constant is also important in
controlling the quality of the process. Without knowing the time
constant, compensating adjustments are made during the transient
portion of the process and the output of these will vary. The transient
time is often a great deal larger than anticipated by conventional
wisdom and can negatively impact the DOE outcome.
The two primary approaches used by fabrication engineers to resolve
processing issues are either to employ their basic understanding of the
process mechanism, or to use a DOE that is a statistical analysis
method. In the case of a DOE, there are two basic assumptions. First,
that all of the primary independent variables are included in the
experiment, and second, that the process is not time dependent. If
either of these underlying postulates are not the case, then the DOE
will most likely be a failure.
In the past, most of us have experienced DOEs that generated results
that were unrepeatable or erroneous. Given the pressures of the
situation, we often resort to intuition to resolve technical problems.
The purpose of this article is to analytically quantify one of the
potential pitfalls mentioned above, which will corrupt the results of
even the most carefully planned and executed DOE. In particular, many
DOEs involve processes that, at least initially, are not stationary and
a startup transient exists. Typical examples are wet chemistry
processes. We all realize that initially such a process may be
transient, and we may attempt to compensate for this by allowing the
process to “settle down” before collecting any
data. Often
the marker that defines the “settling point” is
something
as significant as a subtle change in color.
Investigative Model
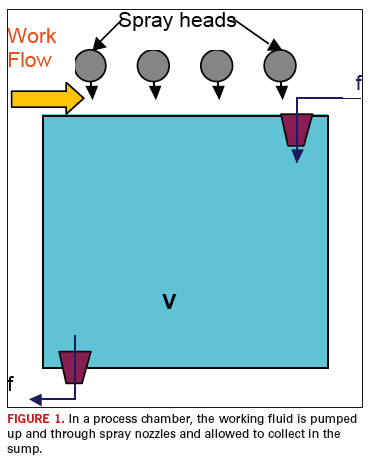
The process that will serve as the focus of interest for this analysis
is the single chamber inline counter flow processor as shown in
FIGURE 1.
Processors of this design are used as etchers, developers, surface
preparation, etc. This example is selected since it is one of the
simplest wet chemistry processes in the industry.

In this case, a working fluid is circulated at a rate, designated
f,
into and out of a holding tank. The fluid is pumped through the spray
heads and onto the work piece (panel) where it removes the unwanted
(and potentially troublesome) materials from the panel. The working
fluid then drains from the panel and back into the holding tank
bringing with it the unwanted superfluous material. This process
increases the concentration of the superfluous material in the holding
tank, consequently reducing the removal rate of this unwanted
contaminate. It is assumed that the removal rate is inversely
proportional to the concentration of the contaminate material. From
this point forward we will draw on the analysis developed in the
reference.
Analysis
One of the primary dependent variables characterizing the DOE would be
the concentration of superfluous contaminate material introduced into
the holding tank. That is, the ratio of the superfluous material to the
volume of the tank, and it is a major variable influencing the
dissolution rate of the working fluid. At any time
‘t’, the
concentration ‘β’ is:

where:
β
ƒ
is the stationary concentration of the working fluid
β
i
is the initial concentration of the working fluid
is the time constant of the transient
portion of the process
t is time
Analytical relationships for the solution concentration and the time
constant in terms of the independent processing variables are found in
the reference
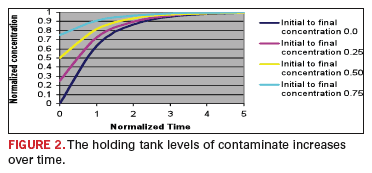
1. We will first focus upon the
time constant. The exponential behavior of such a process is depicted
in
FIGURE 2.

It is normally assumed that the process is stationary after four time
constants (when the transient is 98% complete). Obviously, it is
imperative that the time constant be determined.

where:
is the turnover time of the holding tank
and

where:
V is the volume of holding tank
ρ is the density of the
superfluous material being removed from panel
A is the active area over the holding
tank
E
m is the maximum
removal rate of superfluous material from panel.
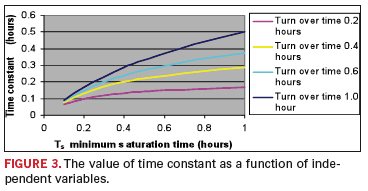
FIGURE 3
shows the value of the
time constant as a function of these independent variables. It is not
unreasonable to expect the time constant to range between 0.2 and 0.4
hours. The implication here is that the process does not become
stationary until 0.8 to 1.6 hours (four time constants), and before
starting the characterization of the stationary process (by a DOE),
this much time should be allowed to elapse after startup or the
validity of the evaluation will be in doubt.
Similar observations can be made concerning processing production grade
product immediately after startup. For instance, since the
concentration of superfluous material in the working fluid is
increasing, the removal rate is decreasing, and consequently, the break
point occurs later in the process.

This analysis has been carried out using a very simple process to
illustrate the point. It is important that the physics of the process
be understood before attempting to optimize it by carrying out a DOE.
In particular, the time constant of the process should be estimated
either by an analytical calculation or a series of measurements prior
to conducting the classical DOE.
PCD&F
REFERENCE
1. “A Mathematical Model for an Inline Counter Flow
Processor”, J. Lee Parker, Ph. D., IPC Apex, April 2008.
J. Lee Parker
is president of JLP Consultants and can be reached at
This email address is being protected from spambots. You need JavaScript enabled to view it..


