Despite a few blips, the overall salary numbers hold strong. But designers seem more cynical than ever.
The results of the 2006 Designer and Design Engineer Salary Survey
are in. Overall, the benchmarks of the survey were unchanged from last
year, and after the volatility of the first few years of this century,
maybe continuity is a good thing, especially in the PCB design world.
Salaries
dropped a hair compared to those reported in last year's survey. The
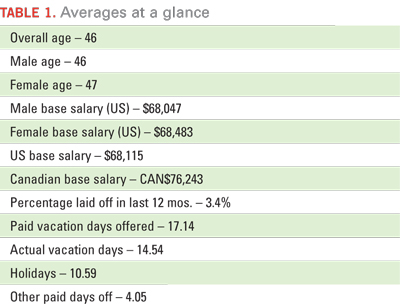
overall base salary of U.S. respondents for 2006 is $68,115, vs.
$70,317 in 2005. Statistically, that's not much of a downward trend.
This
year, more than 75% of respondents said they had received raises in the
past year, up from 71% last year. And most PCB designers and design
engineers are employed now. The number of respondents who reported
being laid off within the last 12 months stayed statistically flat,
dropping a tenth of a percent, from 3.5% in 2005 to 3.4% in 2006. On a
non-scientific, purely anecdotal level, I haven't heard from too many
out-of-work designers or design engineers in the past year.
There
are virtually no new PCB designers and designer engineers reflected in
this survey, and the average age of respondents continues to rise. Last
year, the average male age was 45, and females averaged 46. This year
those numbers are 46 and 47, respectively.
Asking
about educational background is almost a waste of time; with no
"newbies" entering the workforce, we almost always find that about 62%
of respondents have less education than a four-year college degree.
Design is, right now, a zero sum game. But if new hires begin swarming
into the design field, we'll be able to track it through the Salary
Survey.
I could almost write the age section of the
Salary Survey articles without even seeing the results. I hereby
predict, though I hope I'm wrong, that the 2016 male and female
respondents' average ages will be 56 and 57, respectively.
As I've reported in previous years, the majority of designers and design engineers we've tracked through Printed Circuit Design and PCD&M
salary surveys started working between 1975 and 1985. Another big chunk
started working in the early ‘70s. This combined group has been
working its way through our statistics, with no one ready to take their
places when they retire.
The lot of the PCB designer
and design engineer seems to be improving. Salaries have been making
their way upward for some time now: Former PCD Editor Nick Lester wrote
in the 1999 Salary Survey that the combined average U.S. base salary of
designer and design engineer respondents had just crossed the $50,000
mark. Now that combined U.S. average base salary is almost $70,000.
That's an increase of nearly 40% in seven years, including three or
four years of sheer turmoil. Not too shabby.
Stepping
back for a second, the U.S. economy doesn't seem to be in too bad of
shape right now, but caution remains a watchword. The U.S. employment
rate for September was 4.6%; it hasn't been above 4.8% in 2006. The
Bureau of Labor Statistics reported in October that 1.7 million jobs
were added in the previous 12 months, with jobs added for 37
consecutive months.
The Dow Jones Industrial Average
recently broke 11,727, its highest mark since January 2000. But
investors haven't been going hog-wild; this gain came only after
investors made deliberate moves after tediously investigating reports
by analysts and brokers. Don't expect another roller coaster ride on
Wall Street anytime soon.
All this is happening against
a backdrop of strong global competition, and strong growth. The October
JP Morgan PMI Global Report on Manufacturing found that global
manufacturing employment rose for the 16th consecutive month in
September.
Energy prices are dropping after hitting
record post-Katrina highs. Will this cause chemical suppliers to cut
their prices for fabrication and assembly products?
The Particulars
Each
year we try to make the Salary Survey more useful to PCB designers and
design engineers. The idea is for the underpaid among you to use these
data as leverage to get raises. Every year we hear from happy designers
who have received raises or at least gotten their managers to consider
raises. Last year I even heard from an unhappy manager. Hey, the data
are what they are.
In the past, we've mailed surveys,
included them in the printed issue of the magazine, and bribed
subscribers with dollar bills. This year, like last year, we posted the
survey on a secure section of the PCD&M site and e-mailed survey
links to all of our subscribers who indicated on the subscription forms
that their job functions were Design/System/Electrical Engineering,
Engineering Management or PCB Design/Layout/Circuit Design/Circuit
System Packaging Design.
The survey was posted Aug. 23
through Sept. 15. This year, 766 designers and design engineers
responded to the survey. Of the 766 total, 532 hailed from the U.S., 47
from Canada, and the rest primarily from Europe and Asia.
The
term "respondents" refers to PCB designers and design engineers from
around the world, unless otherwise specified by job function, country,
etc.
Go West, Young Man
The 1936 Mae
West movie title could apply to anyone seeking the highest base
salaries for PCB designers and design engineers. California had the
highest U.S. respondents' overall base salary this year, dislodging
Massachusetts from the top spot it held in 2005. Figure 1
reflects the states that are home to the highest numbers of survey
respondents. California rose $3K from last year, to $88,421, edging out
the Bay State at $80,491, which rose about $4K from 2005. Arizona
jumped $6K YOY to place at $75,697, while Texas stayed at fourth, flat
at $72,852.
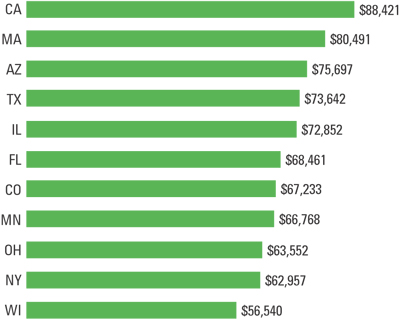
FIGURE 1. Average salary by selected states.
|
Ohio left its' seat in eleventh place and
claimed ninth place with $63,552, a meteoric rise of $13K from 2005.
New York dropped from ninth place last year ($64,271) to tenth place
with $62,957. Wisconsin fell from tenth place in 2005 ($56,219) to
eleventh place by averaging $56,540 in overall base salaries.
When we broke down U.S. respondents' overall base salary numbers by city (Figure 2),
California claimed most of the highest-paying cities. No surprise that
Silicon Valley's Santa Clara and San Jose came in first and second at
$107,500 ($119,000 in 2005) and $96,922 ($106,110 in 2005),
respectively. Fremont came in at $85,000, and Anaheim at $83,667. San
Diego brought up the rear at $78,679, down from $80,625.
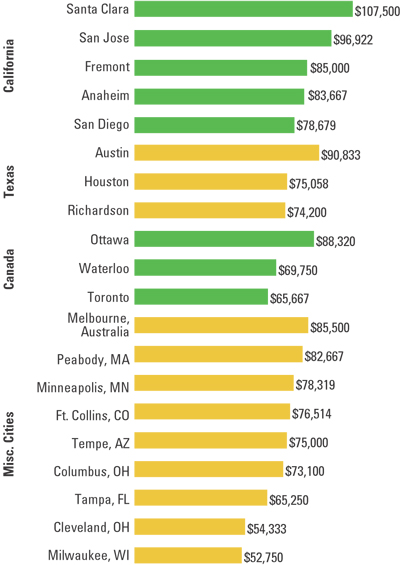
FIGURE 2. Average salary by selected cities.
|
Texas salaries are always interesting to work
with. The Austin folks skew the state averages skyward, thanks to the
higher salaries paid by AMD, Dell and HP. Austin comes out on top at
$90,833 ($97,250 last year), with Houston ($75,058, up from $67,180 in
2005) and Richardson ($74,200, up from $69,200 last year) bringing up
the rear of the Lone Star State.
Among other cities,
Cleveland is still in the low fifties ($54,333) but Columbus jumped
from $54,500 last year to $73,100 in 2006. Did we just catch a whole
new group of respondents, or was 2006 a very good year in Columbus?
Same for Minneapolis, up from $63,500 last year to $78,319 this year.
Peabody, MA, jumped from $69,246 in 2005 to $82,667, while Ft. Collins,
CO, headed northward from $69,333 last year to $76,514 now.
In
Canada, Ottawa is the place to be in 2006, with respondents pulling
CAN$88,320, up from CAN$77,233 in 2005. Toronto rose from CAN$58,500
last year to CAN$65,667 this year. And Waterloo increased from
CAN$62,000 a year ago to CAN$69,750 in 2006.
Sometimes
there are statistical reasons for these variations. But I see many of
the same names every year when we pull the survey data. Any
year-to-year changes we document could reflect real increases or
decreases.
Your company type is another good way to
compare apples to apples. This year, 65.1% of respondents work for
OEMs, followed by 10.3% toiling away as consultants or contractors. The
other employer types were in single digits. (OEMs are always the single
largest employers of survey respondents.) Among U.S. respondents (Figure 3),
consulting/contracting showed the highest base salary at $96,462,
followed by EDA software vendors at $88,857. A few respondents working
for PCB assemblers clocked in at $80,161, while OEMs and PCB
fabricators were tied at almost $73,000.
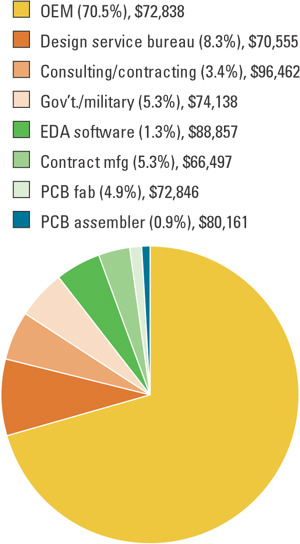
FIGURE 3. Average salary by company type.
|
Going by end-product or service (Figure 4),
U.S. respondents involved in communications equipment came out on top,
at $79,714, the same salary as in last year's survey. Last year,
computer/office equipment took first place at $88,742, but that
category dropped to $76,196 in 2006. Consulting, which brings in so
much salary when taken as a company type, has for years been doing less
well when considered as an end-product or service, and this year
consulting-as-service dropped to $58,543 from $62,085 in 2005. We allow
respondents to check off more than one end-product or service, which
might account for the discrepancy between consulting as a company and
as a service.
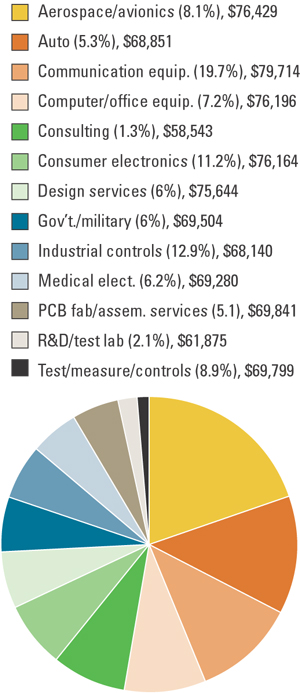
FIGURE 4. Average salary by end product.
|
All About You
Again, our
respondents were overwhelmingly male, but the ladies have been growing
in number each year. This year, 87.2% of total respondents were male,
down from 91.1% two years ago. (In the design engineers-only survey of
2004, women made up only a few percent of the total respondents.)
Only 14.2% of total respondents were single, about the same as in
previous years. That number should hold until more young people enter
the field.
A
majority of respondents – 57.7% – have less than a four-year
college degree. Of all respondents, the largest segment reported having
an associate's one- or two-year degree (26.9%), followed by 22.7% with
some college classes but no degree, and high school grads at 8.1%. Of
the total, 13.8% reported having a bachelor's degree other than an EE,
and 12.5% said they held BSEE sheepskins. Those with master's and
doctorate degrees numbered in the single digits.
Among the 532 U.S. respondents (Figure 5),
a few of you with EE Ph.D.s led the way with $122,000 average base
salaries. Those with a Ph.D. other than an EE came in next, at $103,000.

FIGURE 5. Average salary by education.
|
While engineers must have a college degree, a
degree often has little influence upon the salaries of our design and
layout respondents. The slight difference between the average base
salaries for a high school grad ($69,020) and someone with a bachelor's
other than an EE ($73,050) tells the tale. In the 2003 Salary Survey,
high school grads beat non-EE college grads in average base salaries,
$66,845 to $64,915. That was a one-time result, but a college degree
doesn't seem to have much influence on salaries for those on the PCB
design and layout side.
Many of you got started in this
industry before the first Reagan administration. Guess how many of the
766 total respondents reported having less than one year of experience?
Three. And only 53 had between one and five years of experience.
Among the 532 U.S. respondents (Figure 6),
the largest single segment (24.8%) reported having 26-30 years of
experience and pulling down an average base salary of $81,670. Those
with 16-20 years (18.5%) earned $76,741, and those with 11-15 pulled
$68,472. The lonely guy with 1-5 years of experience made $58,700,
which isn't bad, especially if he's one of the PCB designers with just
a high school degree.
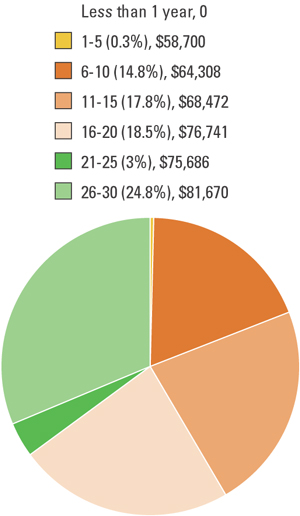
FIGURE 6. Average salary by years of experience.
|
The satisfaction levels of respondents are always instructive. Basically, respondents tend to love their career choice (Figure 7), if not their particular job (Figure 8).
In career satisfaction, 82.7% of respondents are satisfied or very
satisfied. How many careers have numbers like that, besides
firefighters and a few others? But current job satisfaction is lower,
as it often is, with 67.1% reporting that they are satisfied or very
satisfied with their current job. Is the grass always greener at
another company? According to some of the comments we received, the
answer is yes.
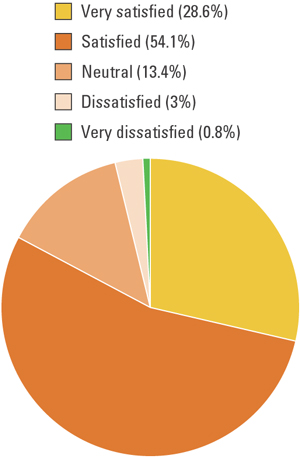
FIGURE 7. Average salary by satisfaction with career.
|
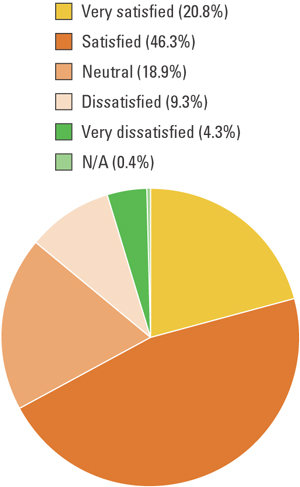
FIGURE 8. Average salary by satisfaction with current job.
|
In other 2006 Salary Survey news, 70.1% of
respondents had some experience with lead-free designs, and 73.8% would
like to know more about IPC standards. Nearly 75% said they did not
have CID certification, and 59.4% said their companies don't support
CID anyway.
Functionally Literate
Each
year, the meat and potatoes of this survey is the job function
information. Job function is what you do during the day that causes
your manager to hand you a paycheck.
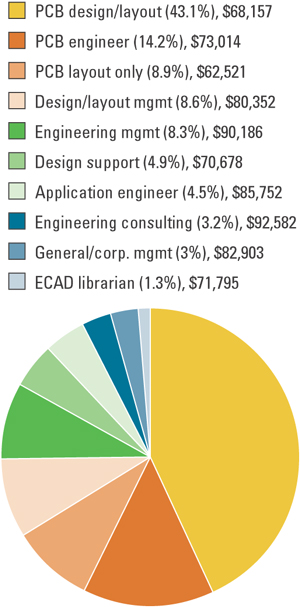
FIGURE 9. Average salary by job function.
|
Job function (Figure 9) is the
best barometer for comparing apples with apples in average base
salaries. This year, as in 2005, engineering consulting and engineering
management led the way, with $92,582 and $90,186 respectively.
Application engineer averaged $85,752, followed by general/corporate
management at $82,903 and design/layout management at $80,352. PCB
engineer earned $73,014, with PCB design/layout (43.1% of U.S.
respondents) clocking in at $68,157. PCB layout only came in at $62,521.
This
year, we experienced technical difficulties with the job title data, so
we weren't able to come up with averages based on job title. But job
title information is less useful than that of job function. One
company's "PCB design manager" may perform exactly the same job
function as another company's "CAD manager." (We're not just saying
that because we don't have the data.)
As always, respondents'
comments are all over the place. Some of you love your jobs; others
can't wait to get out of this industry and never look back. Some of the
better comments, slightly edited:
- Getting paid for connecting the dots rules!
- As
greedy managers, and government, continue to outsource our jobs to
foreign entities, how long will it be before the "international
businesses" decide they do not need the expensive U.S. managers and
distributors?
- As much as they keep trying to shove
all facets of operations to China/Hong Kong/Taiwan, I think that the
industry is finding out there is a huge communication disconnect
between the customer and the design engineering staffs.
- This
is still a great job! A very satisfying and challenging profession! I'm
so very lucky to be involved in the design of printed circuit boards!
- RoHS seems to be counterproductive.
- I've
seen very little new blood in the industry in the past 10 years or so.
In Connecticut few companies are hiring PCB designers on a permanent
basis.
- I think that I am fortunate that I have a job that I love.
We
hope the results of this survey help you get a raise, even though the
odds are that you're satisfied with your job and your career.
We've
covered the geographic areas that were home to the most respondents. If
you'd like further information, contact me and I'll tell you what we
know, if anything, about design or design engineering jobs in your
area. PCD&M
Andy Shaughnessy is editor at large for PCD&M. He can be reached at This email address is being protected from spambots. You need JavaScript enabled to view it..


