 When you ask for Cp (or Cpk), are you really getting Pp (or Ppk)?
OK, I admit it: I was trying to be funny in the title. But the issue is how capable is a capability study? Or, to state it another way: When should we be careful in how much we trust our capability study results?
Here are three items we should be aware of when designing, running and calculating a capability study:
- Cp versus Pp.
- The distribution of the data.
- Sample size.
This column will discuss Cp versus Pp. Future columns will cover distribution of the data and sample size issues.
First, let’s agree to just discuss overall capability, i.e., tolerance range / 6*sigma. Everything discussed below will apply to Cpk and Ppk as well.
Cp versus Pp. As many readers probably already know, the difference between Cp and Pp lies in how the standard deviation (sigma) is calculated.
Cp uses a standard deviation calculated from the “within” variation (when there are logical sub-groups). Pp uses all the data regardless of sub-groups to calculate the standard deviation.
As an example, assume I am printing solder paste onto a PCB. I could do one of three things:
1. Select one pad and measure the paste thickness, then repeat that same measurement on the same pad for each sequential PCB until my desired sample size is reached.
- Cp (using “within” sigma) would be calculated from the moving range (à la I-mR charts).
- Pp would be calculated using the total data set and the standard formula for sigma.
2. Select several pads on the PCB (maybe five total, one near each edge and one in the middle). Measure thickness of all these pads for each PCB used in the capability study.
- Cp would use “within” sigma calculated from the pooled standard deviation of the five pads in each PCB across every board. (Pooling is similar to averaging the standard deviations of each sub-group.)
- Pp would, as before, use the entire data set and the standard formula for sigma.
3. Collect measurements of paste thickness for each PCB in the capability study but do not keep track of the order of the build or sub-groups of any kind.
- Cp is not possible in this case. Warning! Statistical programs may still assume the data are in time order and calculate a Cp, but in this case Cp should be ignored.
- Pp - yep. Use all the data.
Practically, “within” variation (sigma) will be equal to or smaller than the sigma calculated from the entire data set. Therefore, Cp will be equal or higher than Pp. Cp will contain only the common cause variation and not the special cause variation. Therefore, Cp is one measure of how good the process could become if all special causes are eliminated. Pp contains both common cause and special cause variation and is one measure of how the process is doing today.
It may help to see an example to understand the difference. Pretend we are measuring drilled holes in a PCB. The Minitab charts (FIGURE 1) show normal “drilled hole” data. The time series plot (at the top) shows a gentle descent of the data over time – a special cause event, which could be due to drill wear. We can also see that the Cp = 36.42, while Pp = 1.45.
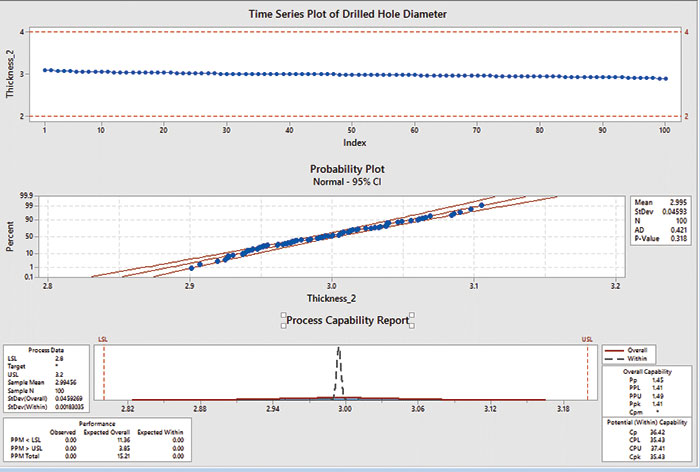
Figure 1. Minitab charts showing process capability.
We can interpret these results to mean that as of today our process has a capability of 1.45, but if we could identify and eliminate the special cause condition, we could be as good as 36.42. Maybe not the best example, but I hope it helps illustrate the concept.
Quite often if a customer asks for capability data, they will receive from the supplier a list of data and a “Cp” value. Always question the supplier whether the data are in time order or if there are logical sub-groups. Is the capability reported actually Pp?
Bottom line is that many speak of and report Cp (or Cpk) values when they are really giving Pp (or Ppk). The differences are subtle, but can be critical.
John Borneman is a Six Sigma Master Black Belt with over 40 years' experience in electronics manufacturing; This email address is being protected from spambots. You need JavaScript enabled to view it..


