The profession is ever more lucrative, but aging, based on our annual survey.
“We’re all on a safe trajectory until we run out of fuel, [and] the role of the designer is nearing running out of fuel. We need to prepare for attrition.”
So said Jennifer Waskow, a printed circuit design manager at Rockwell Collins, during a user group conference earlier this year. Based on the results of the latest PCD&F designers’ salary survey, the time to prepare is at hand.
The 2015 Designers’ Salary Survey offers good news and troubling news. The good: Results indicate higher salaries and bonuses, larger staff sizes, increased benefits and educational opportunities, and less concern about job security. In other words, the economy, with regard to bare board design, is excelling. The bad: There still aren’t enough young designers to replace those who are really near the end of their careers.
From mid-June to mid-July, Printed Circuit Design & Fab conducted a global survey of bare board designers, managers, and design engineers, receiving 499 qualified responses, up from 428 last year. Data compiled included salaries, job functions, titles, project types and quantity, benefits, education, years of experience, challenges, locations, ages, and end markets, to name some. This year, PCD&F also asked about the number of circuit board designers companies employ worldwide, as well as in which regions these designers are being hired. Survey results are intended to paint a picture of the state of the industry rather than provide a thorough scientific study.
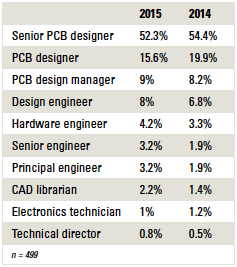
Of the 499 respondents, nearly 68% identified themselves as PCB designers, including the “senior” designation, down from 74% in 2014 (TABLE 1). By contrast, the number of engineers who completed the survey this year rose to 18.8%, compared to 13.9% last year. More than half the senior designers (54%) are in the US, according to the survey. Among other key titles, design manager and CAD librarian percentages both upticked this year.
Table 1. Respondents by Job Title
With that, 73% said their principal job function includes schematic, layout, placement, etc., down from 78% in 2014, while engineering-related job functions increased from 6% in 2014 to 9% this year. Design management and engineering management were both up slightly in 2015. Engineering consulting and ECAD librarian both received more than 2% of responses in 2015.
The number of designers indicating they work for OEMs rose this year as well, to 72%, compared to 67% last year. Designers working for EMS firms/contract assemblers fell slightly from just over 3% in 2014 to 2.4% in 2015. More than one-fifth of those responding indicated they work at least in part at a service bureau. The remainder work for fabricators or in consulting roles.
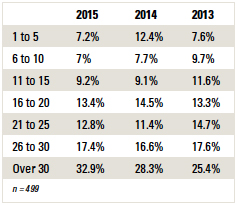
While the 2014 results suggested a possible influx of new, young designers on the horizon, this year’s results reinforced the notion that a staggering number of designers are nearing retirement with too few to replace them. Nearly one-third of this year’s respondents said they have over 30 years of experience in the industry, up from 28.3% in 2014, and up from 25.4% in 2013 (TABLE 2). Those with more than 20 years of experience represented more than 63% of respondents, up from 56.3% last year. Of the designers located in the US, 57% said they have more than 25 years of experience. Global newcomers with 10 or fewer years under their belts accounted for less than 15% in 2015, compared to 20% last year. In the near future, veteran designers could drop dramatically from the survey results as they exit the workforce; it will be notable to observe how the numbers shake out then.
Table 2. Years of PCB Design Experience
Logically, age and experience are increasing simultaneously. Some 59% of designers who took this year’s survey are over 50, compared to 52.9% in 2014, and 66.5% of designers over 50 are in the US. Nearly a quarter of all respondents fall between 51 and 55. Another 18% are under 40, while 28% were under 40 last year.
Demographics based on gender haven’t changed, with males making up 89% of designers who took the survey, flat with 2014.
One reason the average designer age and experience were higher in this year’s survey could be a byproduct of geography. A substantial number of designers who responded to this survey reside in the United States (80%), up from 67% last year (FIGURE 1). Notable US increases included the West Coast at nearly 28%, up from 21%, and Northeast/New England/Mid-Atlantic at 21%, up from 16% in 2014. Europe made up 8% of the respondents. Fewer than 1% of responses came from China this year, compared to 5.6% last year; perhaps the Great Firewall of China is responsible.
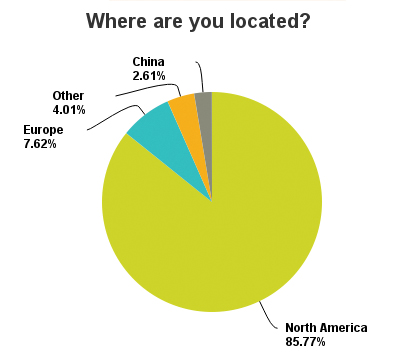
Figure 1. Respondents by location. (n = 499)
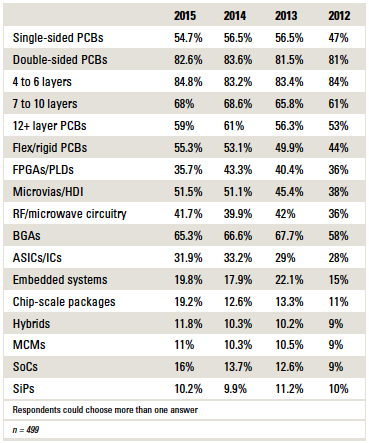
Technology trends and projects were steady, with dips in single- and double-sided boards and increases in most higher-layer-count and rigid-flex substrates. Oddly, BGAs and FPGAs both slipped, although CSPs and SoCs were up (TABLE 3). Again, this could be accounted for by the regional variances in respondents from year to year.
TABLE 3. Projects and Technology Trends
The number of designs produced each year is holding steady, with six to 10 new starts per year the most frequently (24%) chosen response. Just under 60% of designers produce 15 or fewer designs annually. Another 19% produce between 21 and 50 designs, and 7% produce more than 51. These percentages are nearly flat with 2014.
When asked how many circuit board designers a company has worldwide producing these boards, it appears a firm either has very many or very few: The top response was “more than 51” (16%), while the second highest response was “6 to 10” (14%). Another 13% of firms have only one designer, and almost 12% have four or five (FIGURE 2).
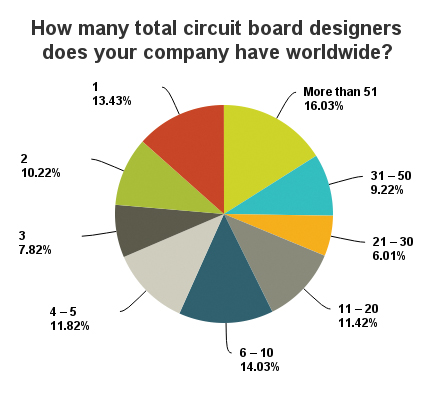
Figure 2. Number of designers per company. (n = 499)
The biggest region employing designers, based on survey results, is North America (89%). Europe had the second highest response (29%), and Southeast Asia (not China) came in third (21%). Nineteen percent of respondents said their firm employs designers in China. All other regions were under 5% each (FIGURE 3).
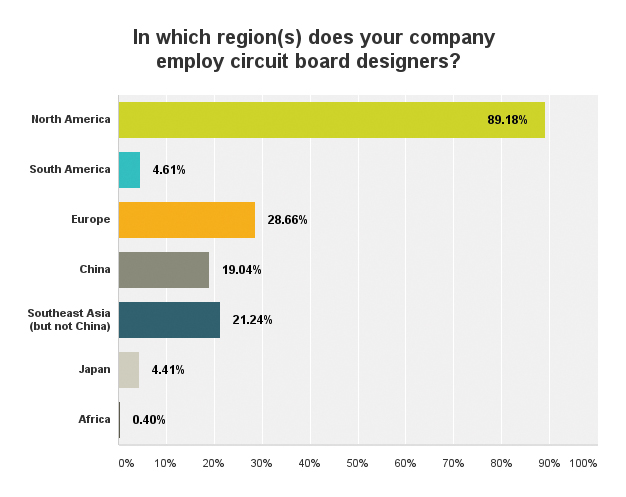
Figure 3. Designers employed by region. (n = 499)
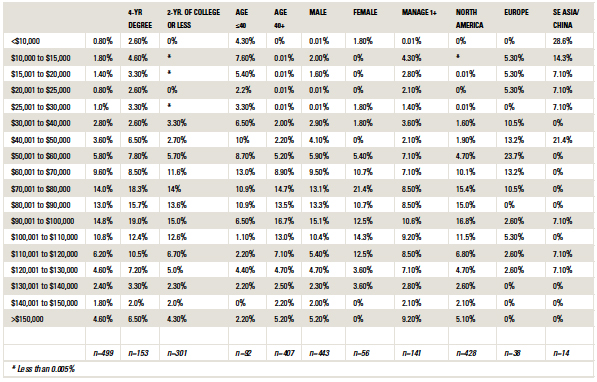
Notable salary increases in 2015 could be a result of mounting years of experience alongside a better worldwide economy. Some 58% of designers who took this year’s survey said they make more than $80,000 annually, compared to 48% last year (TABLE 4). Those making more than $60,000 jumped from almost 70% in 2014 to more than 81% in 2015, based on respondents’ data. About 4% make $20,000 or less, down dramatically from 13.5% last year.
Table 4. Average Annual Salary, by Segment
The percentage of designers who said they receive an annual bonus is up less than one percentage point from 2014 to 53%. However, bonuses for those 53% are escalating in terms of percentage. Some 34% said their bonuses were 4 to 7% of their salaries this year, up from 25% in 2014, while 42% said their bonuses were 1 to 3% of their salaries, down from 51% last year. Another 24% received bonuses that are more than 7% of their annual salaries.
Three-fourths of designers who took the 2015 salary survey said their salaries increased in the past year, compared to about 70% in 2014. Another 21% said their salaries didn’t change during that time, down from 23.5% last year. Fewer than 3% of designers’ salaries decreased in the last year, down from 6% in 2014.
Designers are staying put, with nearly 93% saying they have the same job they had a year ago, nearly flat with 2014. If the data are any indication, layoffs are decreasing, with only about 3% of respondents experiencing a layoff in the past year, down from nearly 8% in 2014.
Designers are no longer as concerned about keeping their jobs as they are about how much work they have to accomplish. When asked what their biggest challenges are, “workload” again received the highest number of responses, with more than 57%, compared to 50% in 2014. Outsourcing (22%) and finding
and keeping a position (25%) are less of a concern; last year, more than 33% were concerned about job stability.
If you’re a board designer, chances are you’ve taken at least one college course. Ninety-six percent of respondents have anywhere from “some college” on their resumes to a graduate degree. More than half (56%) have gone to college but have not completed a four-year degree, flat with 2014. Like last year, 25% said they have a bachelor’s in an engineering-related field, and 9% have a master’s or Ph.D.
Of those who have a bachelor’s degree, more than 67% received their degree in electrical engineering, compared to 65% in 2014 (FIGURE 4). Other engineering degrees made up nearly 10% of responses, compared to 13% in 2014, and “other” degrees outside of physics, math, business, or liberal arts received 11% of responses, down from 14% last year.
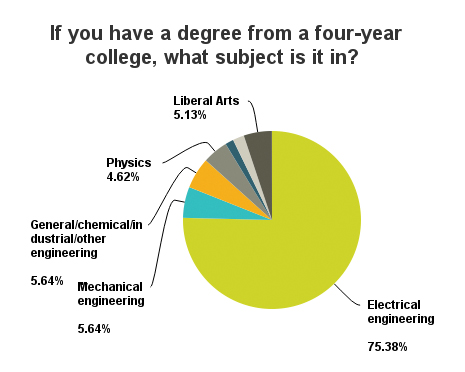
Figure 4. Respondents by college degree. (n = 218)
This year, fewer IPC certified designers responded to the survey (32%), down nearly four percentage points. Of those who are certified, 55% said they are CID certified, down from 56% last year, while 45% are CID+ certified, compared to 44% in 2014.
According to the data, the predominant end-market is government/military/aerospace (20%), up slightly from 2014. In the number two spot is industrial controls/equipment/robots with 15.6% of responses, edging out communication/related systems equipment, which had 13.4% of responses. Medical/optical electronics was in the number four position, with 10%. Consumer came in at 9%, and automotive was at 5%. All other markets were below 5% each.
Based on 2015 survey results, there are noticeable changes in the products and services designers evaluate, recommend, specify or approve. While CAD software still held the top spot, with 84.4% of responses, up from 83.6% last year, there were big jumps in other categories: connectors and cables were up 11 percentage points, and active/passive components gained more than seven points; prototype PCB services and volume PCB fabrication services gained eight and seven percentage points, respectively, and assembly services jumped more than six percentage points to 28.9% of responses (TABLE 5).
Table 5. Designers’ Procurement Responsibilities
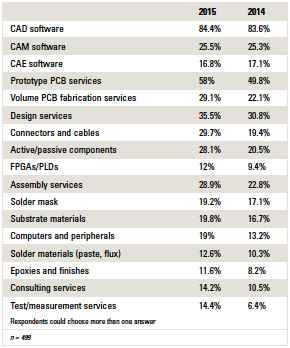
Designers’ highest level of purchase power stayed relatively similar from the previous survey, with 37% able to recommend products, 18% able to evaluate products, and 17% able to specify products. The most notable changes appeared in the number of designers who approve product purchases, with 13% of responses, up from 11.6%, while “none of the above” dropped to 14% from 17%.
Staff sizes took a giant leap in 2015, according to the data, with 53.7% working for companies with more than 1,000 employees, compared to 36.5% in 2014. Designers working for companies with 25 or fewer employees dropped from 20% last year to under 12% in this year’s survey.
Designing is still a solo venture, with 72% saying they don’t have anyone reporting directly to them, compared to 71% last year. Those who said one to five staff members report to them accounted for 22% of responses, compared to about 24% in 2014.
Total annual sales of designers’ companies appear to be on the rise, with 22% stating their firm’s sales are $5 billion or more a year, up from 15% in 2014. More than a quarter of respondents said their firm’s sales are under $50 million, down four percentage points from last year, including 11% under $5 million, down from nearly 15% last year.
Educational opportunities at designers’ companies rose across the board. Tuition reimbursement accounted for 57% of responses, up from 50% in 2014; classes at conferences also increased to more than half (52%), compared to 44% last year; on-the-job training is important, with 57% of responses, up from 51%, and mentoring increased to 36% from 26%.
Along those lines, the benefits picture is improving, with health insurance being offered at 90% of designers’ firms, up from 82% in 2014. Dental insurance received 78% of responses, up nearly 10 percentage points from last year. Three-quarters of designers who took this survey said 401(k) plans are offered, up from 62% in the previous survey. All other company benefits showed noticeable improvements as well.
Big firms appear to have money to spend on designers; college-age men and women should be informed this lucrative career is an option. With on-the-job training available to nearly 60% of respondents, the key seems to be active recruitment, so when the time comes – and it’s coming soon – the industry won’t be left without enough board designers to shoulder the high demand of such an evolving tech sector.
Chelsey Drysdale is senior editor for PRINTED CIRCUIT DESIGN & FAB; This email address is being protected from spambots. You need JavaScript enabled to view it..
Here is the remainder of the results from this year's survey:
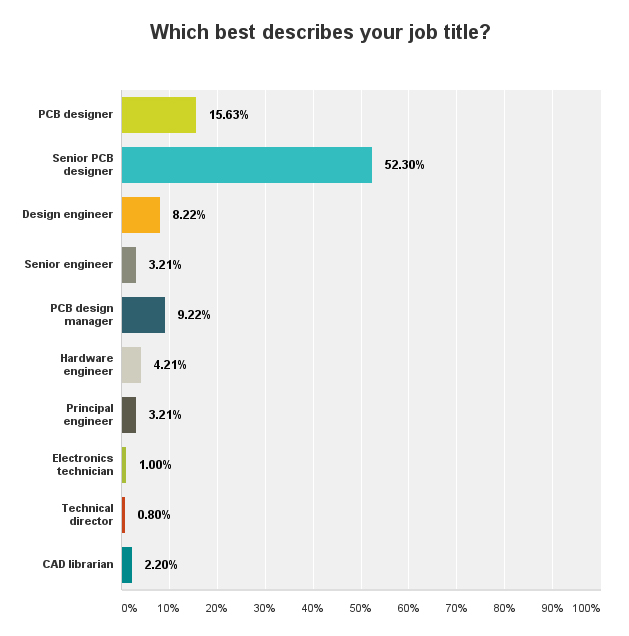
FIGURE 5. Job titles. (n = 499)
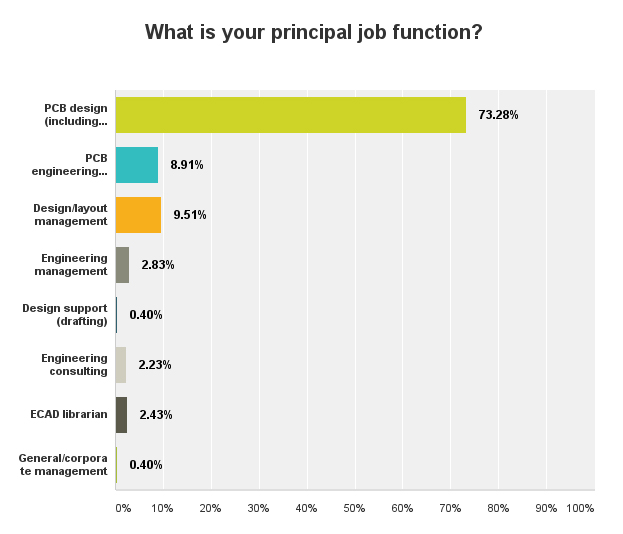
FIGURE 6. Principal job functions. (n = 499)
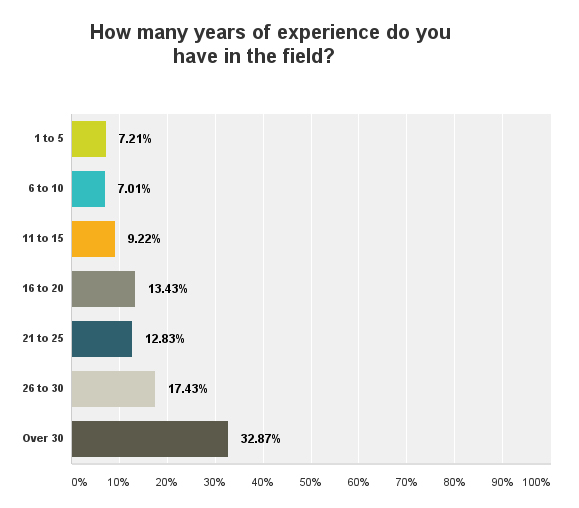
FIGURE 7. Years of experience in the field. (n = 499)
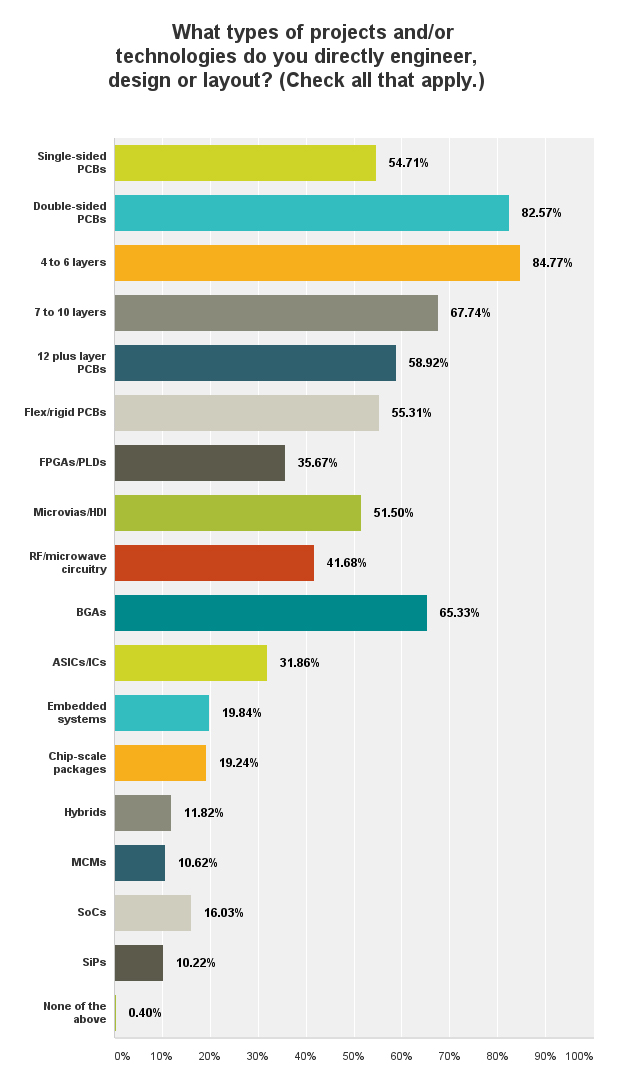
FIGURE 8. Types of projects and/or technologies designers directly engineer, design or layout. (Respondents checked all that apply.) (n = 499)
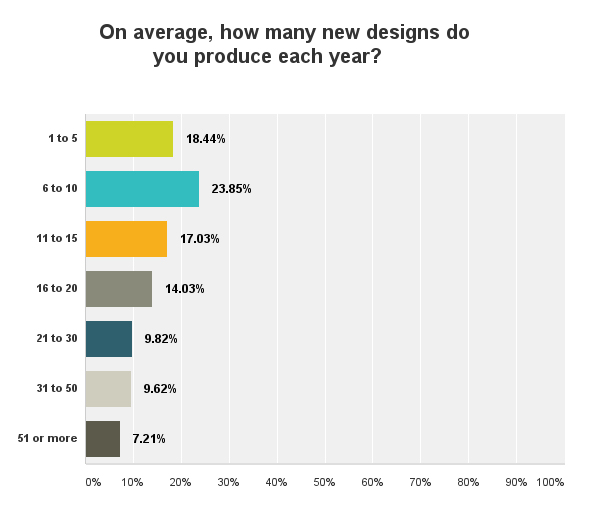
FIGURE 9. Average number of designs produced annually. (n = 499)
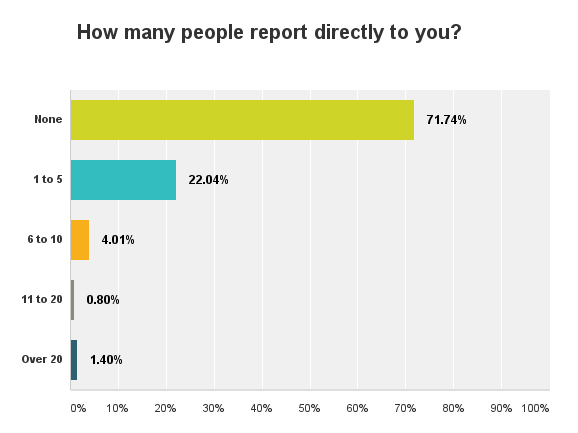
FIGURE 10. Number of staff members who report directly to designers surveyed. (n = 499)
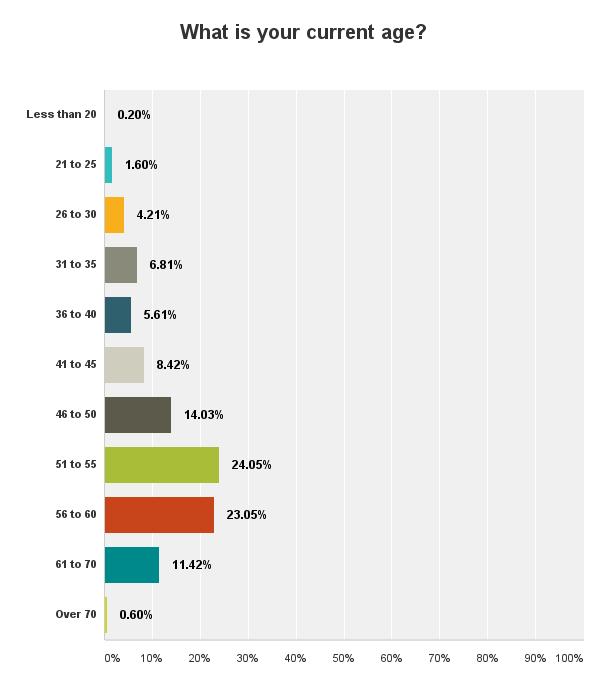
FIGURE 11. Designers' current ages. (n = 499)
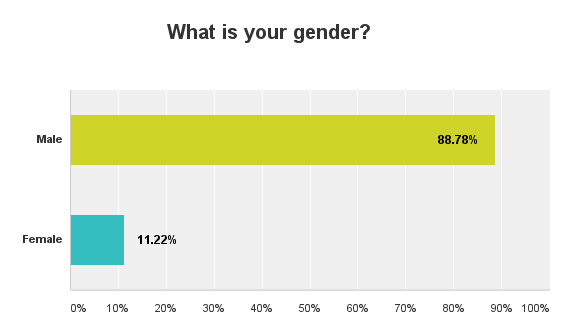
FIGURE 12. Respondents by gender. (n = 499)
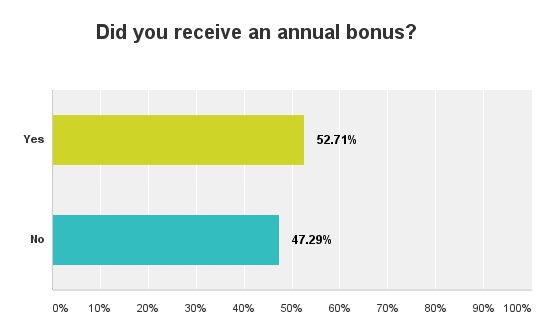
FIGURE 13. Annual bonuses received. (n = 499)
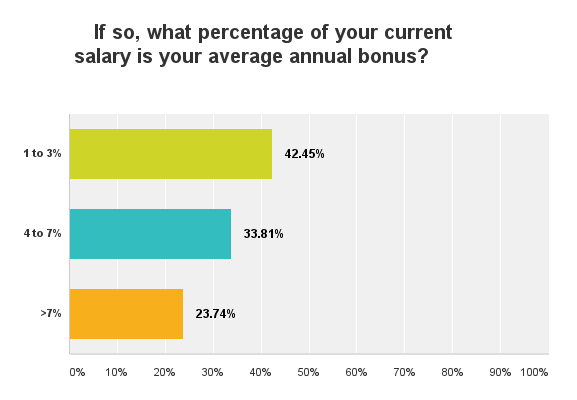
FIGURE 14. Bonuses by percentage of current salary. (n = 278)
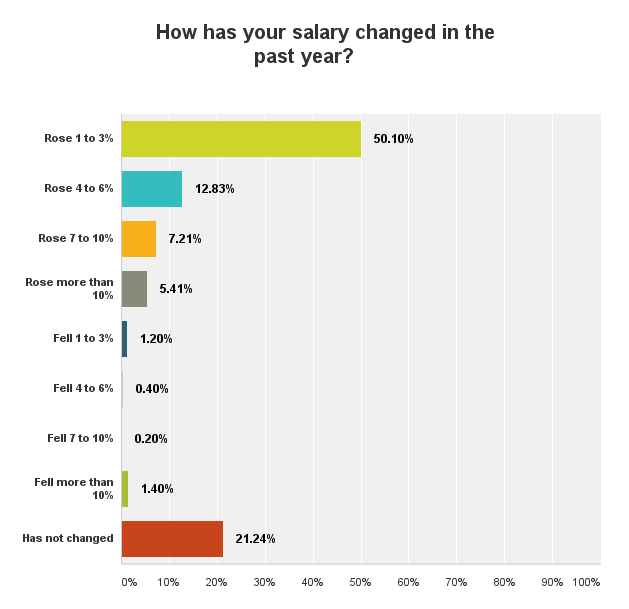
FIGURE 15. How respondents' salaries have changed in the last year. (n = 499)
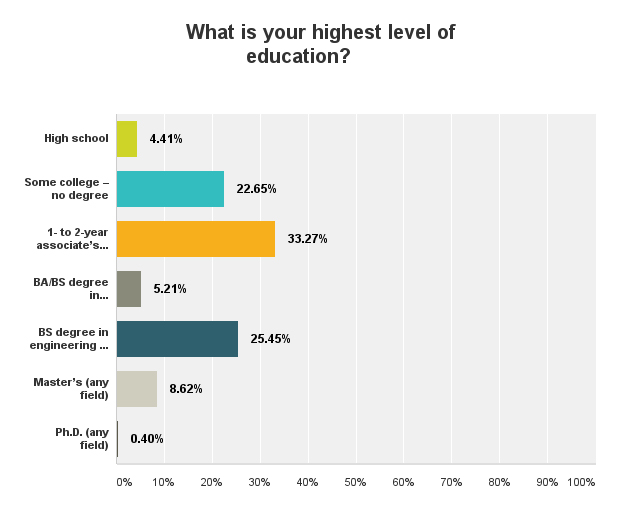
FIGURE 16. Highest levels of education. (n = 499)
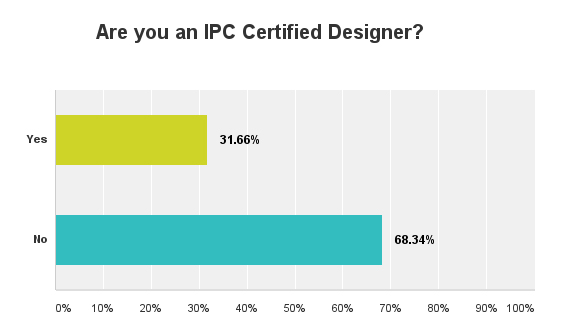
FIGURE 17. IPC certification. (n = 499)
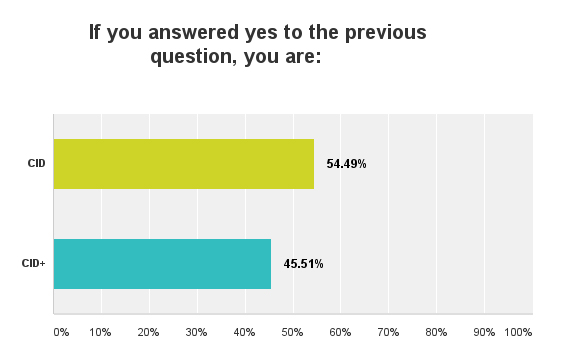
FIGURE 18. IPC certification by type. (n = 156)
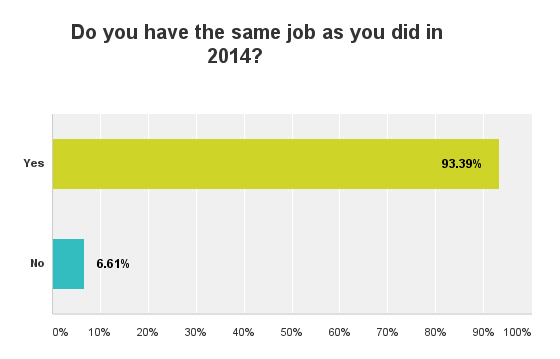
FIGURE 19. Respondents with same job at 2014. (n = 499)
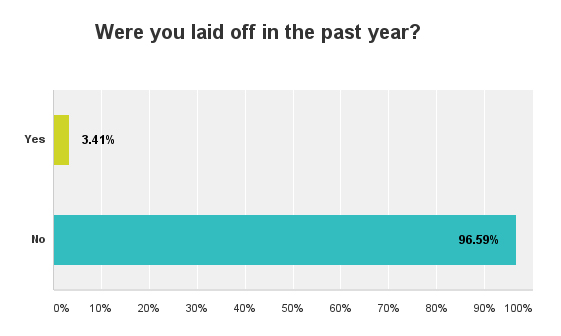
FIGURE 20. Layoffs in the past year. (n = 499)
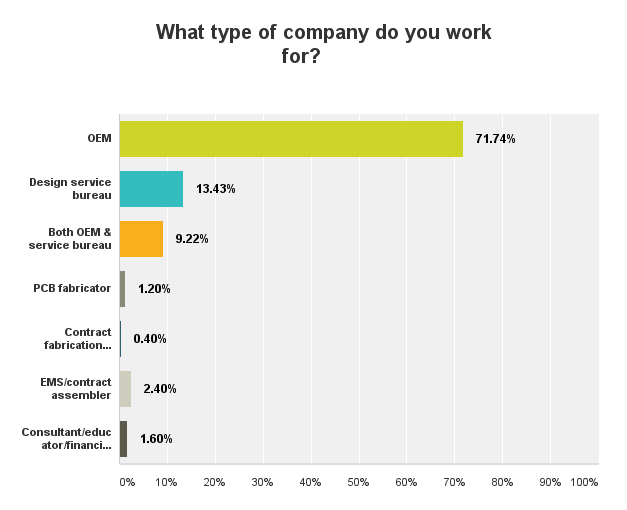
FIGURE 21. Designers' companies by type. (n = 499)
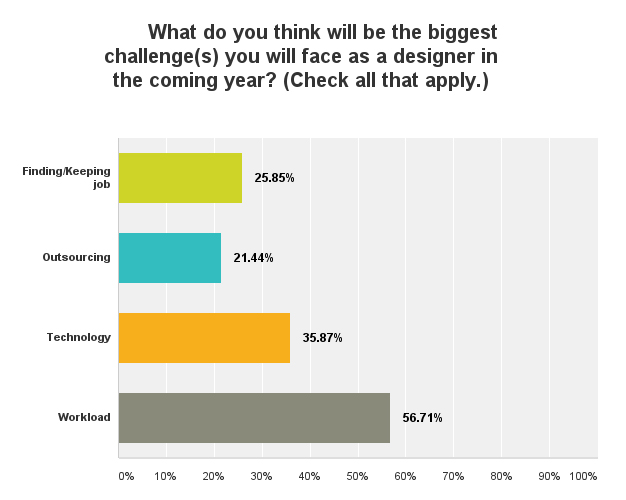
FIGURE 22. Designers' biggest challenge(s) in the coming year. (Respondents checked all that apply.) (n = 499)
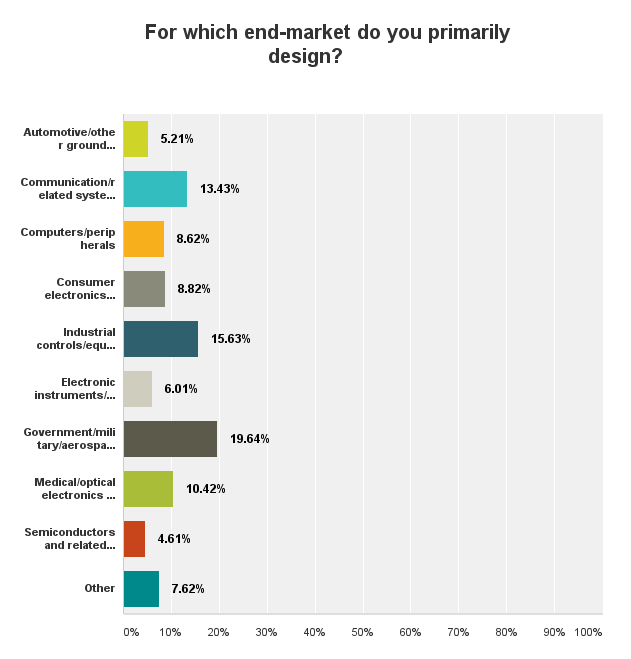
FIGURE 23. Designs by end-market. (n = 499)
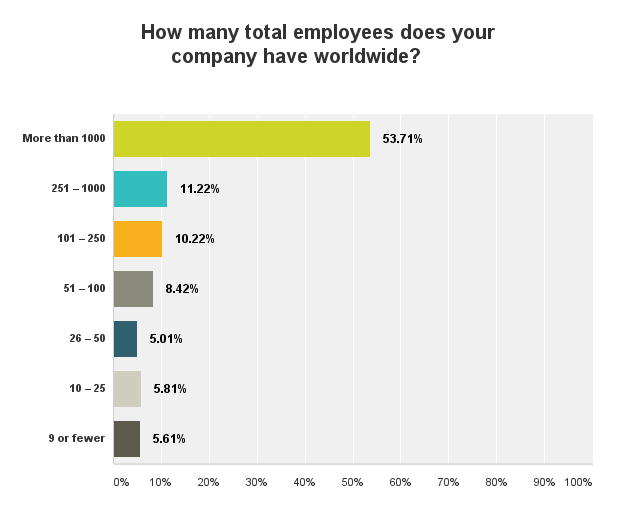
FIGURE 24. Total employees worldwide at designers' companies. (n = 499)
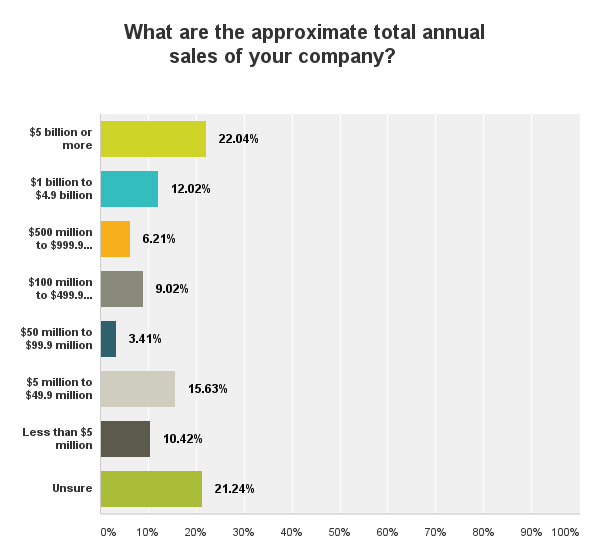
FIGURE 25. Approximate total annual company sales. (n = 499)

FIGURE 26. Educational opportunities at designers' companies. (Respondents checked all that apply.) (n = 499)
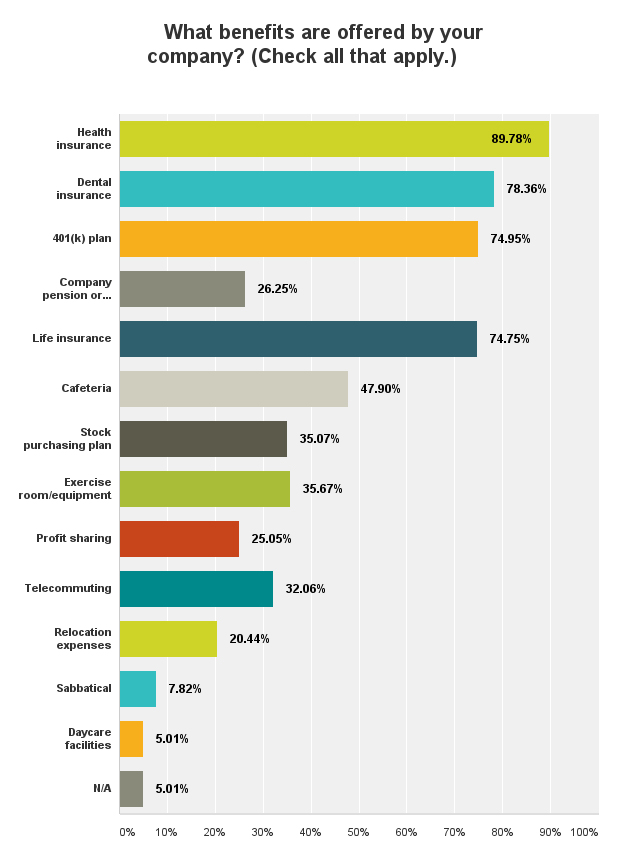
FIGURE 27. Benefits offered at designers' companies. (Respondents checked all that apply.) (n = 499)
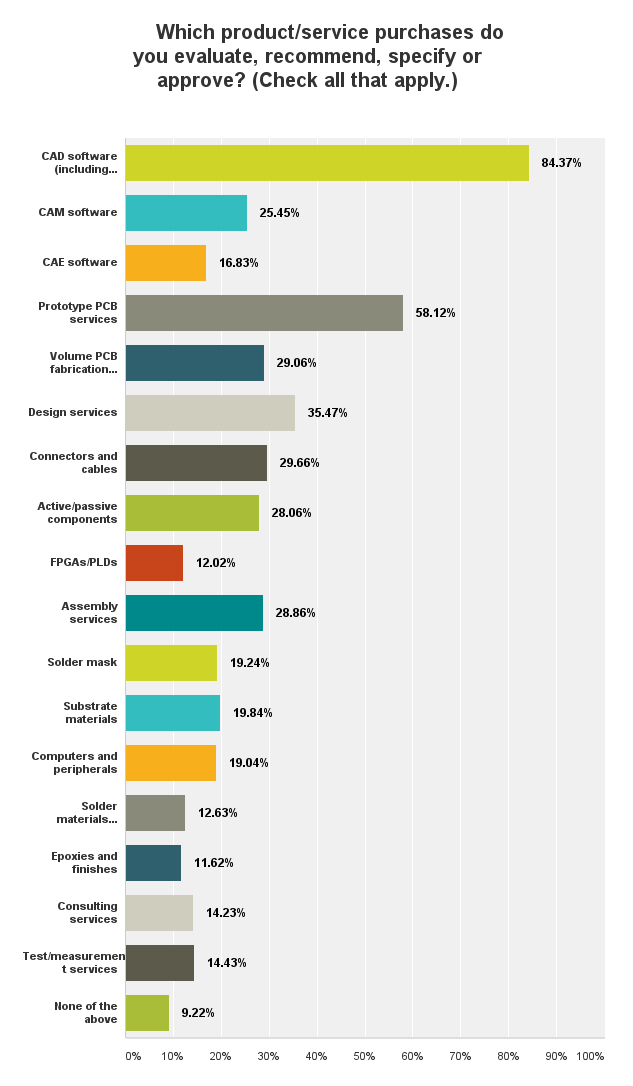
FIGURE 28. Product/service purchases designers evaluate, recommend, specify or approve. (Respondents checked all that apply.) (n = 499)
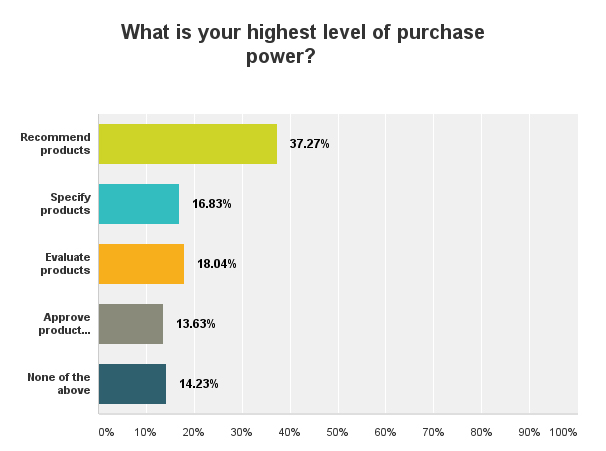
FIGURE 29. Respondents' highest level of purchase power. (n = 499)
Register for PCB West, the Silicon Valley's largest printed circuit trade show, Sept. 15-17 at the Santa Clara Convention Center: pcbwest.com.


