In 2012, PCB designers say their salaries are rising and their challenges are staying the same.
If PCD&F learned anything from this year’s designers’ salary survey, it’s that the overall picture looks remarkably similar to that of 2011.
In late February through March, PCD&F compiled data from 467 bare board designers. The survey, which was conducted online, covered salaries, job functions, titles, types of projects, benefits, education, experience, career concerns, and location, to name some. Results are intended to paint a portrait of the status of design industry jobs, as opposed to a thorough scientific account.
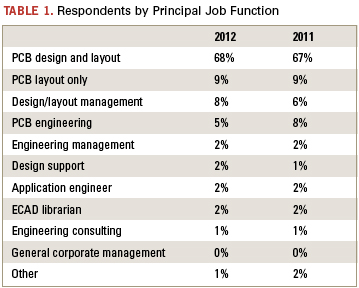
Sixty-eight percent of the 467 respondents listed their principal job function as PCB design and layout – the most common response by far (Table 1). Next was “PCB layout only,” which garnered 9% of responses, flat with 2011, followed by design/layout management (8%, up two points from 2011), and PCB engineering (5%, down from 8% last year).
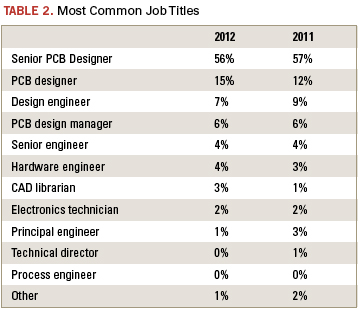
Of those surveyed, 56% are senior PCB designers, down just one percentage point since the 2011 survey (Table 2). The second most selected job title was PCB designer, with 15% of responses, compared to 12% in 2011. Design engineers make up 7% of this year’s respondents, down from 9% in the last survey. Other job titles in 2012 include PCB design manager (6%), senior engineer (4%), hardware engineer (4%), CAD librarian (3%), electronics technician (2%), principal engineer (1%), and “other” (1%).
Designers are still predominantly a veteran crowd, with 53% (compared to 54% in 2011) indicating more than 20 years’ experience in the industry. Twenty-one percent of respondents say they have more than 30 years under their belts, up from 18% in 2011. Sixteen percent indicate 11 to 15 years, 21 to 25 years, and 26 to 30 years, respectively, while 13% say they’ve been in the business for 16 to 20 years. Seventeen percent surveyed are relative newcomers, with 10 years or fewer of experience (3% more than in 2011); only 7% of those respondents indicate five or fewer years.
In response to reader requests, PCD&F sought more detail on where respondents are located with this year’s survey. As with last year, most who took the survey are located in the US (73%); this figure is down three percentage points from 2011 (Figure 1). This year, PCD&F also broke the US into regions. Twenty-three percent of respondents are located on the West Coast (including Arizona). Eighteen percent are in the Northeast/New England/Mid Atlantic section of the US, while 15% live in the Midwest. Eight percent are in the Southeast part of the US; 5% are in the Rockies region, and 4% live in the plains states.
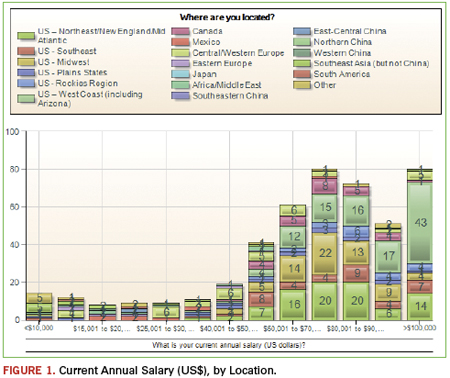
Nine percent of respondents live in Central/Western Europe; 6% are in Canada; 3% are in Southeast Asia (not China), and 3% checked “other.” Only 2% of respondents reside in Mexico and Africa/Middle East, respectively. One percent live in Eastern Europe. Other areas of the globe are not statistically represented in the responses.
The bare board design field continues to be dominated by men; 86% of respondents are male, compared to 88% last year. And the industry is still aging. Fifty-five percent of respondents fall between ages 46 and 60, and another 10% are between 60 and 70-years-old. Ten percent are 41 to 45; 9% are 36 to 40; 7% are 31 to 35, and another 7% are 26 to 30. Only 1% of respondents are under 25. The same question continues to loom: With more designers reaching retirement age than those who are poised to replace them, what will the implications be in the next decade or so in terms of qualified workers? Educators, take note.
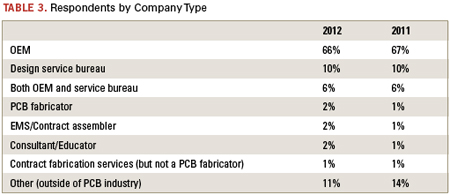
Designers still mostly work for OEMs (66% this year compared to 67% last year). Ten percent say they work for design service bureaus, flat with 2011 (Table 3). Six percent work for both, also the same as last year. Two percent work for EMS firms, compared to only 1% last year. Another 2% work for PCB fabricators, and 2% more work as consultants.
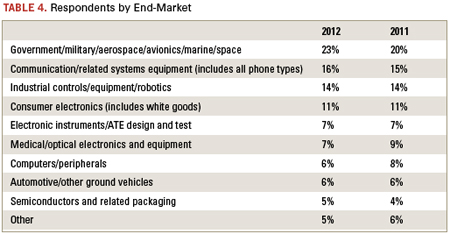
All end-markets are represented by the respondents, and the population by sector generally reflects the overall electronics end-market breakdown by revenue. The largest percentage of respondents, 23%, design high-reliability products (Table 4). Meanwhile, consumer electronics (including white goods) makes up 11%.
Large companies continue to dominate. As in 2011, 40% of survey respondents work for companies that have more than 1,000 employees. Eighteen percent work at firms with 251 to 1,000 staff members, compared to 19% last year. Merely 14% work for companies with 25 or fewer employees, down two percentage points from 2011. Thirteen percent are among a staff of 101 to 250.
Surprisingly, a full quarter of respondents are unsure of their company’s approximate annual sales. Eighteen percent say they work for a firm with $5 billion or more in sales, up three percentage points from last year. The third highest response was $5 million to $49 million, with 15%. Nine percent work for a firm with $1 billion to $4.9 billion in sales; another 9% work for a firm with $100 million to $499 million in sales; 8% said $50 million to $99.9 million, and 7% indicated $500 million to $999 million. Only 9% work for a firm with sales less than $5 million, down from 13% in 2011.
Pay Hikes
The survey asked respondents to characterize current annual salaries in US dollars in five- to ten-thousand-dollar increments. Seventy-three percent say their salary exceeds $60,000, the same percentage as in 2011. Some 28% say their salary tops $90,000, down two percentage points from last year, with 17% of those respondents making six figures – up from 12% last year. Twelve percent make $30,000 or less, with 8% in the $20,000 or below range.
In the past 12 months, 69% of respondents saw their pay increase, compared to 70% at this time in 2011. Of that 69%, the bulk received raises of 1 to 6% (Figure 1). Five percent say their salary increased 7 to 10%, and some 6% saw pay raises of more than 10%. Seven percent indicated a salary drop in the past 12 months, up from 4% last year. The remainder say their salary hasn’t changed.
More than half (56%) of respondents didn’t see a bonus in the last 12 months, compared to 53% last year. Of those who did receive a bonus in the past year, 43% say it was 1 to 3% of their salary, up one percentage point from 2011; 29% say it was 4 to 6% of their salary (same as last year), and 28% received a bonus of more than 7% of their salary, down two points from the 2011 survey.
Health insurance topped the company benefits once again with 87%, up two percentage points from last year’s survey. Dental insurance coverage is provided to 75% of respondents, compared to 73% last year. Life insurance received 73% of responses, compared to 70% in 2011. Sixty-six percent say they have the option of a 401(k) or other savings plan, down two percentage points from the previous survey. Other benefits include an onsite cafeteria (50%); a stock purchasing plan (36%); an exercise facility (33%); a company pension or retirement plan (28%); telecommuting (24%); profit sharing (23%); relocation expenses (16%); sabbatical (6%); daycare (4%), and 7% of respondents say they do not receive any of these benefits with their firm, compared to 9% last year.
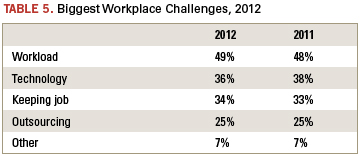
When asked about the biggest challenges designers expect to face in 2012, “workload” is still the top response with 49% of responses (Table 5). Technology is second, at 36%. A close third is keeping one’s job, with 34% of respondents concerned about their job security. Twenty-five percent say outsourcing is their biggest concern, and 7% say “other.”
The survey again asked designers what types of technologies they directly engineer, design or layout. As in 2011, the most responses went to 4 to 6 layer PCBs (84%) and double-sided PCBs (81%). Seven to 10 layer boards garnered 61% of responses; 58% say BGAs; more than half also work with 12 plus layer PCBs (53%); 47% of people say single-sided PCBs, compared to 51% last year. Other responses:
Flex/rigid PCBs: 44%
Microvias/HDI: 38%
FPGAs/PLDs: 36%
RF/microwave circuitry: 36%
ASICs/ICs: 28%
Embedded systems: 15%
Chip-scale packages: 11%
SiPs: 10%
Hybrids: 9%
MCMs: 9%
SoCs: 9%
None of the above: 1%
The number of new designs produced each year could be increasing based on the numbers. Six to 10 designs is still the highest response, with 29%, up from 27% in 2011. Eleven to 15 came in second with 18%; 14% say 16 to 20; 8% say 21 to 30, and 16% produce more than 30 designs each year. This figure is 5% higher than last year. Only 15% say 1 to 5 designs, which is 3% fewer than 2011.
The picture of education looks very similar to the responses in 2011. Again, only 5% say their highest level of education is a high school diploma. Sixty percent have “some college” or an associate’s degree, down from 62% last year. Twenty-one percent have a bachelor’s degree in engineering, flat with 2011. Only 5% have a bachelor’s degree in a non-engineering field, down one percentage point from the previous survey. This year, 9% say they have a master’s degree, which is 3% more than last year. Two respondents say they have a Ph.D.
The majority of companies encourage continuing education, with 55% of respondents saying their firm provides tuition reimbursement, down two points from last year. Fifty-three percent receive on-the-job training, and 45% indicate they have the option of attending classes at conferences, both flat with last year’s survey. Forty-one percent have company-sponsored classes; 28% have mentoring; college classes are supported by 21% of companies, while 20% of them do not provide any of these educational opportunities.
Slightly more respondents in this year’s survey have management responsibilities, but the majority are still not responsible for managing others. Seventy-six percent do not have other staff members reporting to them, compared to 79% last year. Nineteen percent say 1 to 5 people report to them, up 3% over 2011. Four percent say 6 to 10 people report to them, and only 1% are responsible for 11 to 20 other employees. One person who responded to the survey manages more than 20 people.
Thirty-three percent of respondents are IPC certified designers, compared to 36% on the last survey. Seven percent say they were laid off in the past 12 months, compared to 6% in 2011. A whopping 91% say they have the same job as they did at this time in 2011.
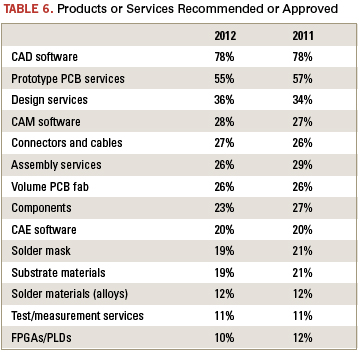
Of those who can recommend or approve product purchases, most get to weigh in on software tools. (Table 6). Twenty percent evaluate products, and 17% specify products. Eight percent can approve product purchases, and 19% lack authority to perform any of these functions, compared to 16% in 2011.
Designers’ jobs and salaries look stable for 2012; the positive improvements that began in 2011 have maintained steadiness.
To view results for the 2011 survey, visit http://pcdandf.com/cms/component/content/article/237-2011-issues/7995-cover-story.
Chelsey Drysdale is senior editor for PCD&F; This email address is being protected from spambots. You need JavaScript enabled to view it..


