3D structures on high-speed signal paths can significantly influence transmitted signals.
Those involved in board analysis during the past 10 years will have noticed changes in signal speed and design applications. The dominant high-speed applications are high-speed memory designs and gigabit-per-second channel designs. At the end of the last century, engineers started routing differential signal nets on PCBs that could transfer data at rates exceeding 1 Gbps. The signals at such speed were initially used to build boards and backplanes in large communication systems. Demand for increasingly fast computation and information transmission continues to increase, with a substantial number of designs operating at multiple Gbps range. Advanced memory designs are moving data at 10 Gbps, and the latest SerDes communication standard is reaching toward 30 Gbps.
With signal speed changes come new challenges of solving design issues never seen before. The components of signal paths on boards and interconnects present problems, such as significant dielectric loss or impedance discontinuity from non-trace portion, which used to be ignored at lower signal speed.
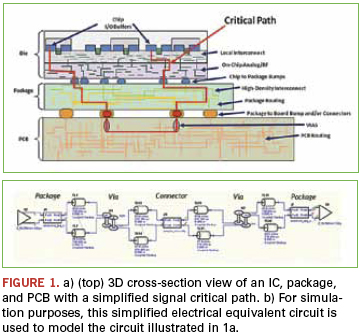
Figure 1a illustrates the three-dimensional cross-section of an IC with a SerDes channel, showing the die, its associated package and pins (or balls), the PCB, and the mechanical mounting of the package on the PCB; Figure 1b shows the electrical equivalent circuit. In this example, the impedance discontinuity contribution comes from the vias for signal switching layers, connectors enabling multi-board connections, and packages. To PCB designers, only via configurations are under their control in these discontinuity contributors.
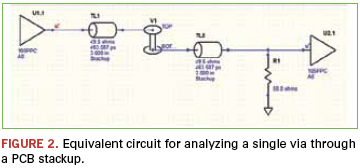
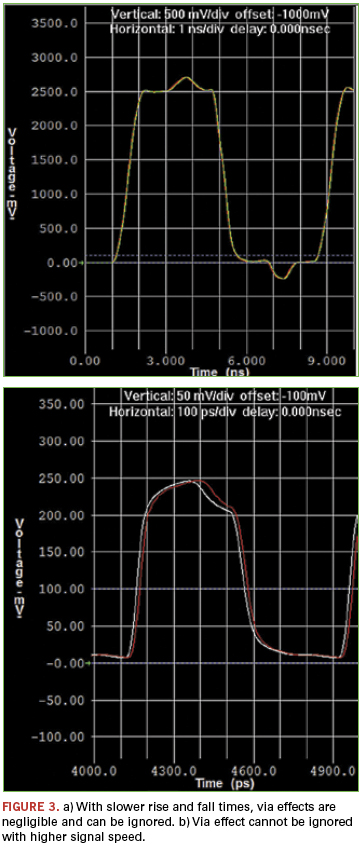
Via modeling. To understand modeling of the vias used in simulation, we’ll begin with a single via in a PCB stackup. Figure 2 is a schematic representation of the equivalent circuit. With slower speeds (that is, slower rise and fall times) common up to a few years ago, via effects were not significant enough to be concerned. Now, with signals having rise/fall times around 100 ps, via effects are noticeable and can cause signal degradation. The typical SI effects of the impedance discontinuity caused by true 3D vias can be seen in the plots in Figure 3.
When simulating a complete channel, signal paths are analyzed using differential vias. Differential vias improve signal integrity, but can also cause signal degradation if the via stubs are not correctly configured. Via stubs not only cause SI issues, they can completely attenuate signals at certain frequencies.
Figure 4 shows analysis on a design with a pair of differential vias on a 16-layer board. The S-parameter plot (Figure 4a) and the eye diagram (Figure 4b) illustrate how via stubs can produce unwanted resonance peaks (8 GHz in the example).
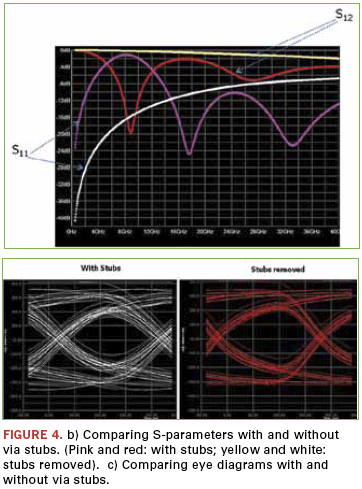
The S-parameter plot shows that the via stubs (red and pink) produce several resonance points, at which point the signal component cannot be transmitted. With the stubs removed (yellow and white), there are no resonance points introduced. Similarly, the eye diagram becomes much smaller with the stubs.
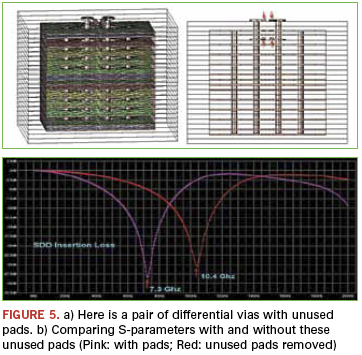
Effects of unused pads. The differential signal paths often enter on one layer and exit on another layer, transmitted between layers through vias. The unused via pads also can cause SI problems. Figure 5 shows the configuration of a pair of vias going through a board stackup of 26 layers. Leaving all these pads in place can cause a resonance peak at lower frequency. By removing the pads, the resonances are pushed upward in frequency, benefiting SI. Backdrilling is the best way to handle these problems, but removing the pads can help the problem when backdrilling is not possible.
Understanding the impacts from 3D structures on signal interconnects is important for designers to ensure good design practice. However, the most common case is to know not only whether there is a design problem, but also how much the effect could be and if a design can still work without significant modification.
To answer these questions, 3D modeling functions are needed to produce detailed results for studying structure behavior and making tradeoffs.
Effectively using 3D modeling. When effectively putting the modeling into practice on an actual circuit, the designer has a number of questions for which he is seeking an answer. Is there an SI problem? If so, what is the magnitude and source of the problem? Can the problem be solved without significant modification, and if not, how much modification is required?
Analysis tools must be capable of answering these questions quickly and accurately. Until recently, 3D analysis of a particular structure has been performed in a separate modeling environment from the general PCB (or package) layout and SI simulation tools. This is adequate for simple structures that can be manually created. But for complex or arbitrary geometries, a standalone tool requires database translation first to get structure geometries imported from layout or port-route analysis environment, which commonly is owned by third parties. In addition, the translation itself can introduce errors during conversion. Conversion can be time-consuming and risky. Also, most tools to date have required that the user have strong electromagnetic experience to use them effectively.
Initial analysis should begin in the pre-layout planning stages. As you could see in the analysis of via stubs, understanding the effects of vias before actually beginning the layout can permit potential problems to be discovered and mitigated before anything has to be unraveled. For this early analysis, it is possible to use a separate 3D tool without much difficulty.
Once pre-layout studies have been completed, the structure is put on board with other nets routed, components placed, and holes drilled. Even so, the resulting PCB layout can still have coupling with some components, and the previously understood behavior can be affected; there may also be new noise sources on the board after layout as well. When this happens, the discontinuity effect from the particular 3D object must be simulated again, including its immediate neighbors, such as nets, other vias, etc. At this stage of development, using a separate 3D tool to analyze the more complicated geometry is very, very tedious.
Better is to have a 3D modeling engine integrated with a general layout and SI environment. The integration then permits detailed structure design/tuning in the pre-layout stage and discontinuity effect verification at port-route level. This solution is illustrated in Figure 6. In this example, Mentor Graphics’ HyperLynx was used first to specify a pair of differential vias in the pre-layout environment (Figure 6a) and determine if a single stitching (or ground) via is sufficient for the required switching rate.
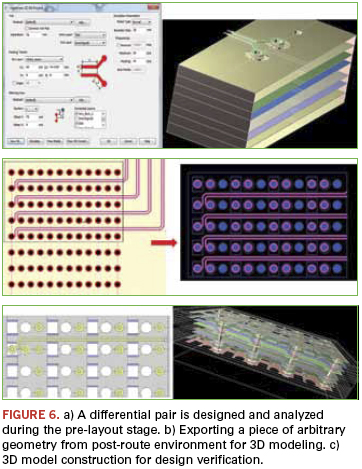
After layout, the designer can select the interested area in the routed design where other nets and structures have been placed near the vias of interest, and tell the tool to export the piece of arbitrary geometry to the 3D modeling engine for creation of proper 3D model (Figure 6b). The resulting model (Figure 6c) highlights the coupling effect to the pre-defined differential via structure. Because the position of geometry cut on the board is known, the 3D model can be connected back to the interested nets in channel simulation. Armed with these data, the designer can then decide if the channel budget can tolerate the effect, or if more design work is necessary to reduce the extra noise.
Dr. Zhen Mu is a product market manager at Mentor Graphics (mentor.com), responsible for signal integrity and power integrity products for printed circuit board and package analysis.


