Stripline models can be used to determine the impact of copper surface roughness on transmission properties.
In high speed digital interconnects, signal attenuation is a result of both dielectric losses and conductor losses. Many articles have shown in detail the characterization and modeling efforts related to the impact of dielectric loss in PCBs and the differences between various dielectric materials1. Nevertheless, high-speed characterization modeling efforts do not often take into account the variations in conductor losses due to copper foil roughness or treatments made to the copper foil to promote adhesion.
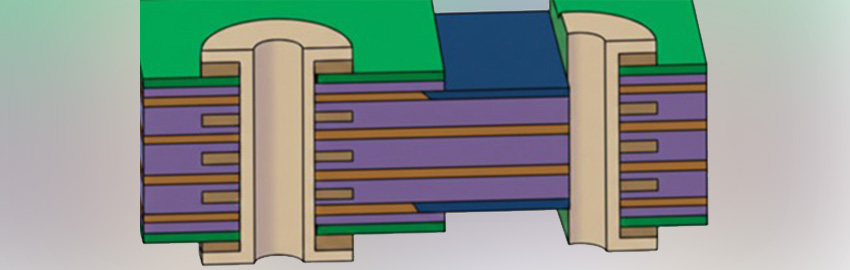
Two types of interconnect structures are mainly used in order to propagate signals in integrated circuits (ICs) and printed circuit boards (PCBs): microstripline and stripline. Stripline is constructed by sandwiching a metallic strip within a dielectric material. The benefit of the closed structure, compared to the microstripline, is better protection against external signals and unwanted radiation.
Stripline is one of the most popular methods to transfer signals in PCBs and ICs. In an ideal world, the conductor would be perfectly smooth and have a perfectly rectangular cross-section. In reality, this is not the case because the conductors have microscopic dips and grooves as a result of the foil manufacturing and PCB fabrication process. Due to the importance of these transmission lines, significant research has been done in the last few years to accurately analyze the transmission properties2-6. A critical aspect of this analysis is the focus on the characterization of the conductor losses due to surface anomalies on the copper traces.
Copper foils are roughened to improve adhesion between the copper and dielectric resin of the laminate material. The adhesion at the interface between the conductor and the insulator must be robust to survive the fabrication, assembly and standard usage conditions.
When the wavelength of the signal has a length comparable to the amplitude of the roughness, the attenuation increases as a function of frequency. It therefore must be taken into account when designing stripline structures. One of the best ways to estimate the incidence on the electrical performance of a stripline due to surface roughness is to consider different profile models.
Test Vehicle
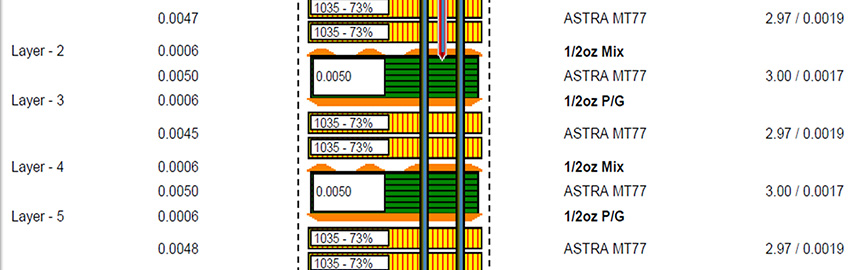
A cross-sectional view of the test vehicle structure, along with the geometric dimensions, is illustrated in Figure 1. It is a 400 µm (L) long copper stripline (σ = 5.8e7 S/m), with a width of 10 μm and a height of 3.5 μm. The dielectric material is FR-4 (εr = 4.9) and is considered loss free with the specific purpose of concentrating the attention on the conductor loss only.

CST Microwave Studio (CST MWS)7 is used to perform the EM numerical simulations. The code is based on the Finite Integration Technique (FIT), an integral method that can be implemented in either time domain or frequency domain.
In this case, the frequency domain solver (with tetrahedral mesh) is used for two main reasons, the structure has relatively small dimensions and the evaluation of the attenuation factor due to conductor loss (α) is not available in time domain.
In order to ensure a transversal electro-magnetic (TEM) structure of the field (essential condition for a meaningful interpretation of the S-parameters), lumped voltage sources are not suitable because they would excite higher-order modes.
Because of this, the TEM excitation has been realized by considering waveguide ports. Figure 1B illustrates the field mode pattern distribution, the line impedance value and the attenuation factor alpha (α): the detected value of the line impedance is approximately 40 ohm while α = 40.98 [Neper/m].
Due to the non-deterministic nature of the surface roughness8,9 (different and complex geometries for the surface profile) there is always a certain level of approximation that will occur, therefore, different models should be developed depending on the surface profile type. A different approach to quantify conductor loss might be to measure the Q-factor of a quarter wavelength resonator10 or to directly measure the insertion loss of a transmission line, but the effectiveness of this method relies on the accuracy of the measurements and the availability of experimental samples.

Figure 2 shows the different surface roughness profiles used to investigate the incidence on the transmission properties of the considered stripline: A) cylindrical, B) triangular and C) rectangular profiles; the geometrical parameters are d, r, h = 0.5 µm and a = 1 µm. The surface roughness is only modelled in the top portion of the stripline in order to reduce the aspect ratio for the full-wave simulation. The relation between conductor surfaces profile (surface roughness) and loss can be defined by Equation 1.

where Rs represents surface resistivity, Z0 is the impedance of the transmission line and w is the trace width. Surface resistance is a material property, partially governed by surface roughness, while Z0 and w are both design parameters. Conductive loss is directly proportional to the surface resistance though the skin effect, as signals travel at the conductor surface at different depths.
Different techniques can be incorporated to generate a loss model that includes the surface roughness effect. A model can be generated by adjusting the classical skin effect conductor loss to a higher power than the square root of the frequency. Another approach is increasing the dielectric loss tangent (tanδ) of the dielectric material, due to the fact that for frequencies higher than 1 GHz, the difference among copper types is almost linear with respect to the frequency.
Both of these approaches have some issues4. Hammerstad and Jensen proposed an empirical formula (Equations 2 and 3), derived from microstripline measurements, and used them to model the frequency dependent loss by means of an additional loss term defined as:


where Rs surface resistivity, Z0 impedance of the transmission line and w, trace width. Surface resistance is a material property, partially governed by surface roughness, while Z0 and w are both design parameters.
Figure 3 compares the insertion loss results due to the full wave numerical simulation for the stripline model represented in Figure 2A with the results due to the Hammerstad and Jensen analytical formulation. A good agreement between the two sets of data is observed.

At this point, all the profiles represented in Figure 2 are modelled and simulated by means of CST MWS and CST Design Studio is used to cascade four blocks of the 3D model in order to get the insertion loss of a 1600 µm long stripline. The simulations have typically used 4 GB of random access memory taking on average, 50 minutes of running time on a 3.6 GHz Intel Pentium D processor. The results are reported in Figure 4.

It is noted that the level of increase in conductor losses is dependent of the shape and distribution of indentation and that the rectangular profile produces different results from the other two cases; therefore, Hammerstad and Jensen analytical formulation is only valid for a specific profile, but for more complex geometries a 3D model needs to be realized and a full wave analysis needs to be performed.
Conclusion
The effect of the conductor surface profile (surface roughness) on a standard interconnect stripline structure was analyzed. The electrical performance of the interconnect was studied in frequency domain (S-parameters), and a consistent decrease in the transmission properties of the line have been highlighted. Hammenstad and Jensen’s analytical formulation is demonstrated to be effective only for a specific profile of the surface roughness; therefore, a unique closed formulation which allows for the modeling of the real copper surface profile is not yet available. Future research will be in the direction of probabilistic approaches that appear to be well suitable for surface roughness modelling9. PCD&F
REFERENCES
- X. Shi, Jian-Guo Ma, Manh Anh Do, Er-Ping Li, “Sensitivity Analysis of Coupled Interconnects for RFIC Applications,” IEEE Transaction on Electromagnetic Compatibility, vol. 48, November 2006, pgs.607-613.
- T. Liang, S. Hall, H. Heck and G. Brist, “PCB Transmission Line Modeling for Multi-Gb/s Link Analysis,” DesignCon East 2005.
- R. Kollipara et Al., “Practical Design Considerations for 10 to 25 Gbps Coppewr Backplane Serial Links,” DesignCon 2006.
- G. Brist, S. Clouser, S. Hall, and T. Liang, “Non-Classical Conductor Losses due to Copper Foil Roughness and Treatment,” IPC Electronic Circuits World Convention, Feb. 2005.
- X.Chen, “EM Modeling of Microstrip Conductor Losses Including Surface Roughness Effect,” IEEE Microwave and Wireless components Letters, vol.17, February 2007, pgs.94-96.
- M.V.Lukic, D. S. Filipovic, “Modeling of 3-D Surface Roughness Effects with Application to µ-coaxial Lines,” IEEE Trans. on Microwave Theory and Techniques, vol.55, March 2007, pgs.518-525.
CST Studio Suite 2008 www.cst.com.
- A.Ciccomancini Scogna, M.Schauer, “Stripline Simulation Model with Tapered Cross Section and Conductor Surface Profile,” Proc. of IEEE International Symposium on EMC, July 4-12, 2007, Hawaii, USA.
- P. G. Huray, S. Hall, S. Pytel, F. Oluwafemi, R. Mellitz, D., Hua, P. Ye, “Fundamentals of a 3-D “Snowball, Model for Surface Roughness Power Losses,” on Proc. of SPI, May 13-16, 2007, Genova, Italy.
- J. Carroll, K. Chang, “Metallization Effects on GaAs Microstrip Line Attenuation,” IEEE Trans on Microwave Theory and Tech. vol.41, July 2003, pgs.1227-1229.
Dr. Antonio Ciccomancini Scogna is a senior application engineer at CST of America Inc. He can be reached at This email address is being protected from spambots. You need JavaScript enabled to view it..