5G Build-Out Will Speed PCB Fabricators’ Gains
After years of taking a backseat to mobile device fabs, multilayer manufacturers stand to reap the rewards.
There is an ongoing changing of the guard when it comes to drivers of the PCB industry. Mobile and PC-related end-products are slowly giving way to the emerging 5G infrastructure. This swing is just beginning to impact the NTI-100 list of the world’s largest fabricators, but it’s only one of the new trends seen as we collected and analyzed this year’s data. Another interesting development: A pair of fabricators from the US and Europe have come to dominate their respective “home” regions.
This year’s NTI-100 report is the 22nd in the “top fabricator” series since the author started in 1998. (The “100” refers not to the number of companies ranked but rather the entities with $100 million or more in PCB revenue in the last calendar year.) As more Chinese PCB fabricators achieve sales revenues of $100 million or more, many privately owned, it is becoming extremely difficult to get accurate data. Without the help of CPCA, this work would have been impossible. The author would like to express his gratitude to Angela Chen of CPCA, who collected valuable data. Although the data have some flaws, they are no fault of CPCA.
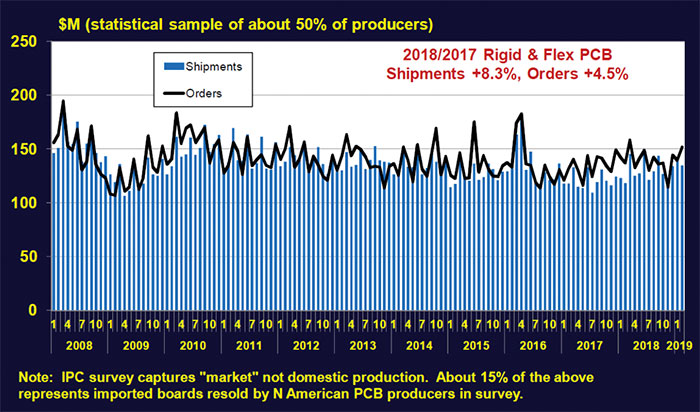
Figure 1. North American rigid and flexible PCB shipments and orders. (Source: Custer Consulting)
Some fabricators may have been missed, and others should not be on the list. There are more than 2,400 PCB fabricators in the world, half in China, and many Chinese fabricators are elusive and hard to get data from. Nevertheless, as usual, any errors are strictly the responsibility of the author. His confidence level in the data’s accuracy continues to decline every year, and if we were to put a number on it, it may now be 95%. He asks readers to be open-minded and tolerant of any errors.
Exchangerate.com shows 268 days of exchange rates for each currency (excluding Saturdays and Sundays). The author added exchange rates of 268 days and divided by 268 to obtain the above average currency exchange rates (TABLE 1).
Table 1. Average Exchange Rates Used to Convert Local Currencies to USD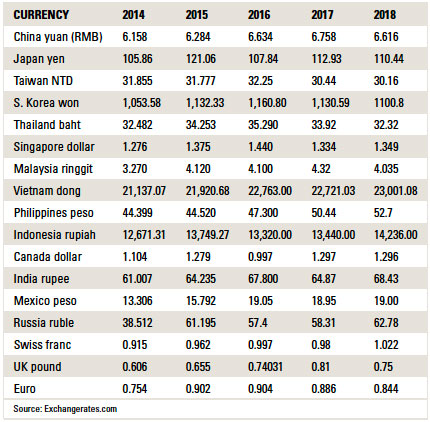
Assumptions
- It is very difficult to prorate portions of revenues of acquired fabricators and incorporate those portions into the revenues of the acquirer. So, regardless of the purchase or merger date, all transactions are assumed to have taken place Jan. 1. A good example is the case of MFlex, owned by DongShan Precision of China, which bought Multek on Dec. 1, 2018. The full-year revenue of Multek is added to MFlex’s totals, despite the acquisition late in the year.
- The PCB business of some fabricators belonging to larger, diversified companies is not reported separately; for example, Sanmina. Publicly held Japanese fabricators report PCB revenues separately, with two exceptions: Kyocera and Murata. The author could not get separate PCB revenues from Kyocera or Murata. Thus, the calculated estimates of the PCB revenues of these fabricators are based on the data he could obtain.
- Many PCB fabricators are now engaged in assembly as well. Separating the bare-board portion from the total will inevitably introduce errors. As in the past few NTI-100 reports, the author chose not to separate assembly values (components and labor costs), although estimates could be made. All flexible printed circuits (FPCs) delivered to Apple are assembled by the respective fabricators prior to delivery. The bare board value of “assembled FPCs” is said to be about 40 to 60% of the total. However, more than 20 FPCs and rigid-flex boards are used in the iPhone X, and the bare board values depend on which models FPC fabricators supply to Apple (ZDT, Flexium, Career, Nippon Mektron, Fujikura, Sumitomo Denko, SEMCO, BH Flex, etc.). The bare board values of these fabricators’ revenues may be only 50% of the total shown.
- Some PCB fabricators’ revenues include subcontracted or brokered board sales (i.e., purchases for resale). Here again, it is impossible to know the accurate resale values for all the PCB fabricators on the list. Therefore, it is assumed the list includes an undisclosed percentage of resale revenues.
In defense of the work and inherent uncertainty, the author advises readers to be content with this work and view the list only as a reference.
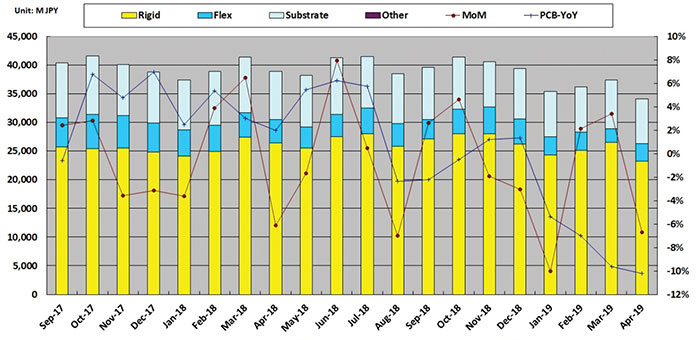
Figure 2. Japan monthly PCB production value. (Source: CPCA summary based on JPCA data)
Analysis
The number of entries (fabricators with revenue ≥$100 million) increased to 117 in 2018 from 115 in 2017 (TABLE 2). However, several fabricators “disappeared” last year because they were purchased and are included here with their new owners. Multek is under MFlex. Elna is under HannStar Board. (The actual owner is GBM, a sister company of HannStar Board, both belonging to PSA/Passive Systems Alliance.) Eastern is now part of South Korean fabricator Simmtech. NBC should not have been included last year; its entire revenue was counted as PCB-related, when in fact PCB makes up just 60% of overall sales.
Table 2. NTI-100 World Top PCB Fabricators by Revenue, 2018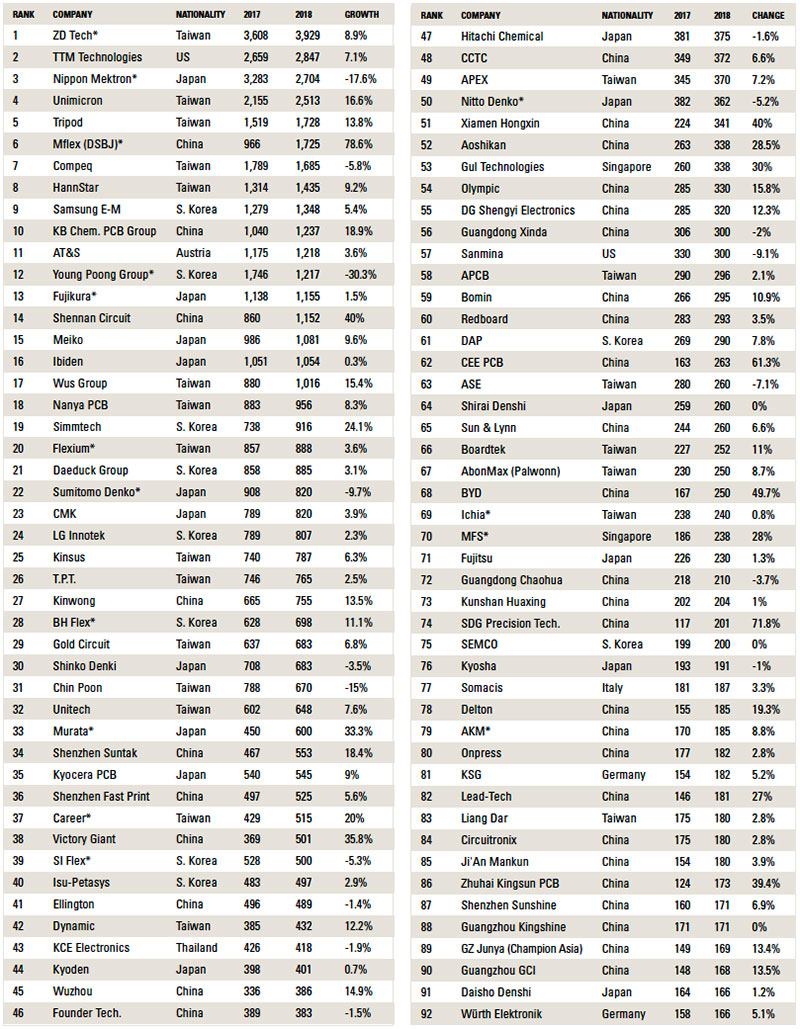
Table 2. NTI-100 World Top PCB Fabricators by Revenue, 2018 (cont.)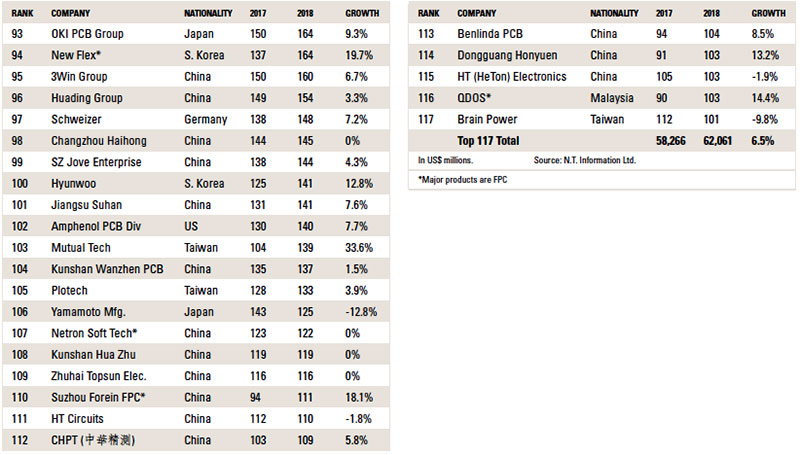
Taiwan is the king of PCBs. China continues growing, and Japan continues to slip, despite an increase in its total revenue. The growth of Taiwan and China, respectively, is faster than that of Japan (TABLE 3).
Table 3. Summary of NTI-100 2018 by Region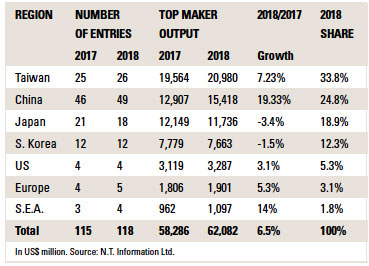
Taiwan gained one entry from 2017. China gained three. Japan lost three. (Mitsubishi Gas Chemical/Taihong Circuit Industry is now under Taiwan.) There were no changes to South Korea and the US. Europe gained one, and the S.E.A. also gained one. QDOS finally made it!
Revenues of top Japanese and South Korean fabricators lost a few percentage points, but all other regions gained (TABLE 4). The top 117 fabricators grew 6.5% from 2017 to 2018, in line with the world PCB output in 2018. (Worldwide growth was 5.6%.) Larger fabricators’ growth was larger by about 1%.
Table 4. World PCB Production by Region*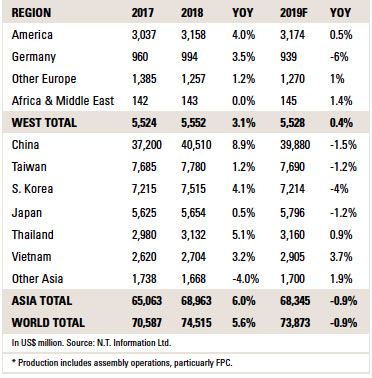
Japan’s decline is due mainly to weaker sales to Apple by Nippon Mektron and Sumitomo Denko, offset in part by strong gains by CMK and Meiko in automotive PCBs. South Korea’s drop is due to Interflex’s loss of Apple business (under Young Poong Group). Apple is problematic for PCB fabricators, despite its huge PCB purchases. Taiwan’s Career Tech had problems with Apple as well.
An interesting observation can be made about North America (read: US and Canada) and Europe. The total North American output in 2018 is estimated at about $5.2 billion, a figure that includes the overseas output of roughly $2 billion by TTM Technologies, Sanmina and Amphenol, with no more contributions from MFlex and Multek. Thus, TTM’s revenue accounts for 55% of all North American fabricators’ output.
AT&S’s China output from two facilities (Shanghai and Chongqing) was $1 billion. Its Indian and South Korean output is an estimated $120 million. So,
including its overseas output, the total AT&S output accounts for 36% of the total Europe-based fabricators’ output (≈$3.4 billion, domestic and overseas) (TABLE 5).
Table 5. Europe PCB Output, 2012-18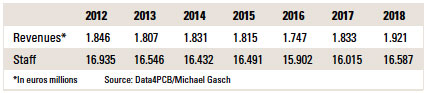
The aggregate Top 117 output ($62 billion) accounts for 83% of the global output ($74.5 billion) in 2018. It has been said that, in general, 20% of the companies in an industry account for 80% of the sales. Considering approximately 2,400 fabricators operate globally, 117 fabricators constitute less than 5% of the total. So, for the PCB industry, 5% of the fabricators are responsible for 80% of the output.
The “domestic” PCB production of once-mighty North America, Japan and Europe has now sunk to the bottom. Their growth comes from overseas plants. The US-China trade war will not affect this pattern insofar as PCB production is concerned. No idiots will bring their overseas PCB production back home, at least in this author’s lifetime.
Japan’s investment in China is finished, and its expansion in Thailand is dormant, except at CMK Thailand. Investment is now concentrated in Vietnam. However, Ibiden and Shinko Electric are investing more than $1 billion combined to cope with demand for high-end chip substrates from Intel, their collective customer which is expanding dramatically in Oregon and Israel. This may change Japan’s domestic picture in a few years.
European PCB fabricators do invest a few dollars, not for capacity expansion but more for accommodating new technologies.
A similar phenomenon is taking place in South Korea, and to a lesser degree, Taiwan. (Sixty percent of Taiwan’s PCB production is made in China, 5% in Thailand, and 35% in Taiwan). As Samsung Electronics continues to shift smartphone production to Vietnam, many South Korean FPC fabricators followed the OEM to the Hanoi area: 10 so far, with more to follow.
The author visits China three to four times a year and makes plant tours of about 60 PCB fabricators, Chinese and foreign. Some of their new plants and expansions are huge! So many new plants have been constructed in the past few years, and expansion continues, albeit more cautiously since the start of the US-China trade war. The author is aware of at least 35 to 40 gigantic new plants that are under construction in China.
Waste regulations are getting tougher in China, particularly “PCB-infested” areas such as Shenzhen and Shanghai Belt. Fabricators that cannot meet government regulations in these areas go out of business. Those that have resources to build new plants choose north of Yangtze River (Nantong, Yancheng, etc.), Hubei province (Huangshi in particular), Jiangxi province (the favorite place for Shenzhen-based fabricators because of its proximity to Shenzhen), and Zhuhai (FIGURE 3).
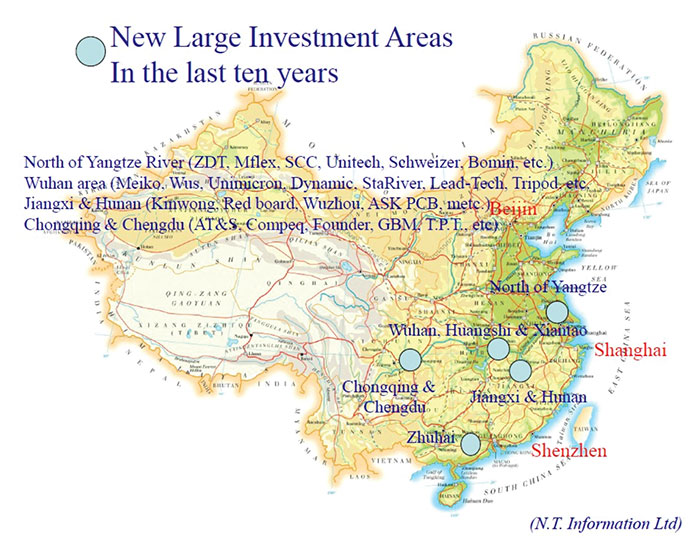
Figure 3. PCB fabricator investments in China in past decade..
In a few years, when all these investments start producing PCBs, the Chinese output may account for more than 70% of the global production, including foreign transplants, mostly Taiwanese. More Chinese fabricators will occupy higher positions on the NTI-100 list, and more Chinese fabricators will achieve revenues ≥$100 million per year.
The author is tiring of this work because it is getting harder to collect data, but he hopes to continue this project to see how Chinese PCB fabricators will grow.
In the 2019~20 period, high-layer count MLB fabricators will gain, thanks to 5G communication infrastructure installations. 2019 is considered a starting point for 5G, and as we enter 2020, demand for base stations, routers, servers, antennas and other equipment will increase. PCB fabricators that can supply to such demands in volume will grow by leaps and bounds.
Automotive unit shipments experienced a hiccup in 2018, and at this moment 2019 does not seem to have brought much improvement. EV shipments are growing at 50% annually, but its share of the total shipment of 95 million to 96 million cars per year expected in 2019 is still less than 3%. “Semi” autonomous cars will start showing up on public roads in 2020, not for testing but for carrying passengers. (We say “semi” because the level of autonomy will be level 3 or 4, at best.) It will take a few more years before we see fully autonomous cars without steering, brakes and accelerator pedals (level 5) running on the roads. But, the electronic content of the car is expected to increase continuously (FIGURE 4). Therefore, automotive PCB fabricators will perform better, despite eroding selling prices of PCBs for automotive applications. Japanese and Taiwanese fabricators dominate automotive PCB production (TABLE 6).
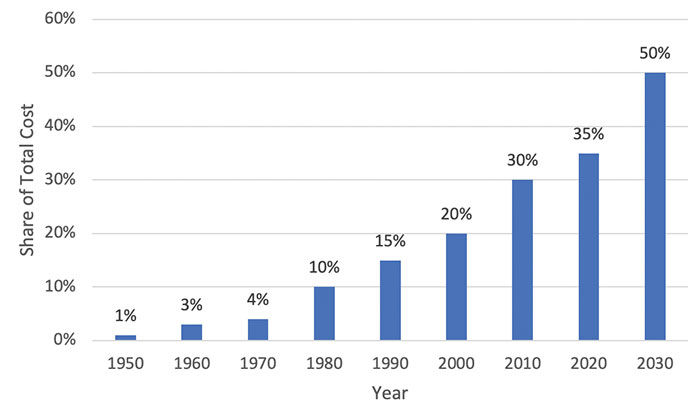
Figure 4. Automotive electronics cost as a percentage of total car cost worldwide, 1950 to 2030.
Table 6. World Top 20 Automotive PCB Fabricators, 2018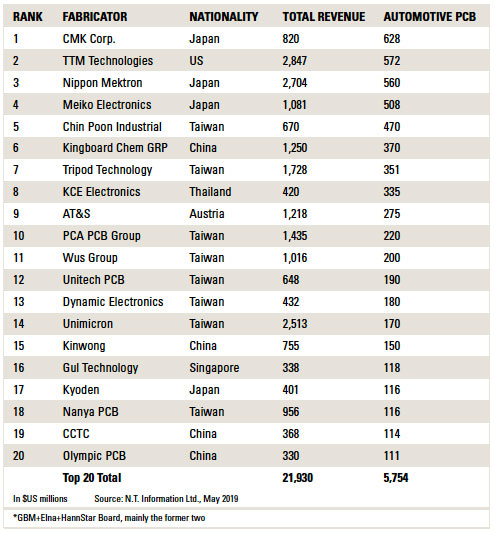
PC shipments had a surprise rise in the second quarter, despite pessimistic forecasts (TABLE 7). According to the Gartner research firm, OEMs sought to ship as many units as possible before higher tariffs were imposed. PC motherboard suppliers are singing happier notes at this moment, although the long-term prospects are still not so bright (TABLE 8).
Table 7. Worldwide Device Shipments by Device Type, 2018-2021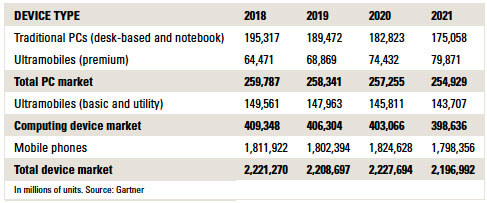
Table 8. Top 5 PC Shipment OEMs, Q2 2019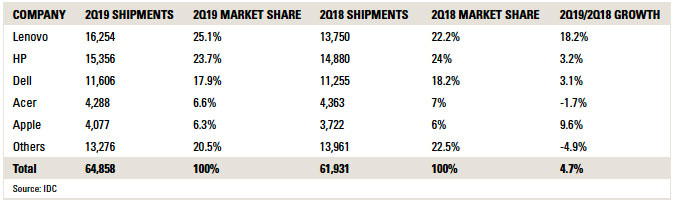
In conclusion, this year’s winners will be those that cater to 5G infrastructure, automotive electronics, IC substrates, and, still, smartphones (absorbing 20+% of all PCBs despite its slow growth). Gains from other industries will be infinitesimal.
is president of N.T. Information; This email address is being protected from spambots. You need JavaScript enabled to view it..


