Dielectric Performance in Lead-Free Assembly
New test methods offer powerful tools to help understand circuit board failures and the role of materials in PCB reliability.
It has been demonstrated that lead-free assembly and rework of printed circuit boards (PCBs) can reduce reliability by up to 50% in well-fabricated products. There are two main reliability influences in lead-free applications: copper quality and material robustness. The reliability impact of copper quality is readily evaluated using thermal cycling, while monitoring resistance in test circuits, followed by a microscopic evaluation of plating variables and failure analysis. The reliability impact of materials, however, is not so directly evaluated. Although materials impart the z-axis expansion that causes failure, the material itself is not normally monitored in reliability testing. Traditionally, the investigation of material damage in the reliability testing of bare PCBs has been limited to random microscopic evaluation. Materials traditionally considered robust are now failing in a lead-free application. In response to the need to quantify the material’s role in reliability, two unique material test methods have been developed: cyclic time to delamination at 260°C (cT260) and detection of material degradation in representative test coupons by Dielectric Estimation and Laminate Analysis Method (DELAM). This article offers an overview of these two evaluation methods, their applications and benefits.
Those familiar with RoHS requirements and the response of the electronics industry to the removal of lead from products understand that increasing the assembly temperature from 230°C to 245°C or 260°C has had a significant influence in reducing PCB reliability. A well-fabricated PCB’s reliability is typically reduced 50%, while poorly fabricated PCBs may fail in assembly, resulting in an otherwise robust product now vulnerable to failure. The failure modes may be classified into two general groups: interconnect failures and material failures. Interconnect failure includes increased incidences of corner or knee cracks, interconnect or post failures, pad rotation and other copper related discrepancies. Material may fail by delamination, cohesive failure, propagation of crazing and material degradation.
In conjunction with damaging of the interconnects, lead-free assembly and rework damages the dielectric material. The dielectric materials addressed in this article are limited to epoxy fiberglass substrate, designated G-10 and FR-4 (flame retardant class 4). The dielectric material is frequently bonded to copper, and the copper and glass components of the base material are less affected by the thermal cycles associated with lead-free assembly and rework than the epoxy. The epoxy portion is vulnerable to the thermal cycles associated with lead-free assembly and may fail. Failure is the result of mechanical stress and chemical degradation induced by thermal excursions. Frequently, the effect of material degradation, like delamination, is to artificially extend the thermal cycles to failure in reliability testing by stress relieving the coupon. Delamination, or cohesive failures, may reduce cycles to failure, but this is infrequent. Although significant material failures may reduce damage accumulation in the test sample, these failures change the electrical characteristics of the PCB and can provide a path for conductive anodic filament growth (CAF). Changes in the electrical characteristics of the PCB may be found in electrical testing after assembly, while CAF-type failures may develop in the end use environment.
Presented with the challenge of degrading materials, the two test methods were developed. These methods were developed to understand and to quantify material degradation in response to thermal excursions. Cyclic Time to Degradation (cT260) is a thermal mechanical analysis method that ranks a material's robustness; Dielectric Estimation and Laminate Analysis Method (DELAM) is a capacitance-based method requiring specifically design test coupons (Interconnect Stress Test – IST). While cT260 establishes a material’s propensity to cause interconnect failures, DELAM confirms PCB construction and monitors for significant material degradation during reliability testing.
Cyclic Time to Degradation at 260°C expands upon an established industry standard test method, developed and accepted by the IPC and contained in the IPC TM-650 Test Methods Manual, Time to Delamination (TMA Method) 2.4.24.1 testing with an isotherm of 260°C. For convenience, I will refer to this IPC method as T260, while the new cyclic method being proposed will be referred to as cT260. The IPC T260 method prescribes a constant ramp (scan) rate to an isotherm of 260°C or 288°C. The new protocol, cT260, expands on the T260 method by adding six thermal cycles before the isotherm.
The equipment used for both the T260 and cT260 methods is a Thermal Mechanical Analysis (TMA) tester. TMA accurately measures small changes in sample size in response to temperature. By measuring changes in size through a tightly control temperature range, TMA allows one to determine the coefficient of thermal expansion (CTE) in parts per million and the glass transition temperature (Tg) based on changes in CTE. For the T260 method, TMA is measuring the time to a catastrophic material failure. Held at an isotherm, a sample may be monitored until there is catastrophic failure in the material or between laminated surfaces. The failure is usually expressed as a sharp irreversible increase in size.
The test samples are cut to about 0.25 inches square and are usually taken from the edge of a test coupon or the PCB. The samples need to be laminated and have copper ground planes, with no holes or interconnect structures. The samples are placed on a quartz stage, and a quartz probe is lowered onto the top of the sample with a downward force of 0.005 Newtons (5g). A small electron furnace is lowered around the sample, probe and stage. Around the furnace is a refrigeration unit referred to as a “cold finger” which cools the furnace during the heating cycle. Cooling while heating a sample allows for precise control of thermal ramps and prevents over shooting the 260°C isotherm. Nitrogen gas floods the furnace, helping to conduct heat while providing an anhydrous and oxygen-free environment. Small changes in size are sensed through the probe with a LVDT (linear variable displacement transducer) and recorded in a file.
The T260 protocol requires a laminated sample to be heated with a well-controlled, constant scan (ramp) rate to an isotherm at 260°C. Time to delamination is defined as the time from reaching the isotherm to an irreversible increase in size. The abrupt change in size is expressed as a spike at the time of failure. The specified scan rate is 10 degree sign/minute, although the 100°C scan rate option has proven to be more effective.
The goal of the cT260 method is to emulate assembly and rework cycles prior to the isotherm established in the T250 method, referred to as preconditioning. In the current cT260 method, an IST 260°C preconditioning profile was emulated. Any preconditioning profile may be programmed, but by using the exact preconditioning used in IST reliability testing, a direct relationship is established between reliability cycles to failure and cT260 results.
The cT260 method uses six preconditioning cycles that are defined in five increments in TABLE 1. It can be described as heating to a lead-free precondition temperature of 260°C in exactly three minutes. There is no hold time at temperature; instead, the sample is cooled as fast a possible to below Tg before the next thermal cycle. On the seventh thermal cycle, the sample is held at the 260°C isotherm to failure. A failure is considered any spike in size during the preconditioning cycles or at isotherm. The isotherm is held for a maximum of 90 minutes, which is considered the end of test.
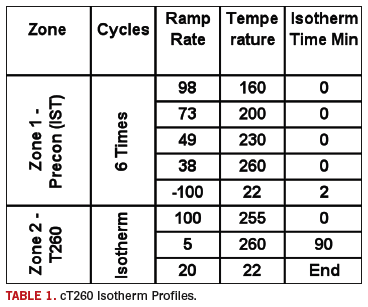
The cT260 thermal profile may be broken into two zones: the preconditioning zone (Zone 1) and the isotherm zone (Zone 2). One would expect material decomposition to occur in Zone 1, but experience demonstrates that most materials fail after achieving the isotherm. On occasion, a sample will fail during the preconditioning phase. It is thought that materials that fail in the preconditioning phase may have a mechanically-induced failure mode, such as a breakdown of oxide coating on copper planes or out gassing of trapped moisture. Since the TMA samples are small and there is a high ratio of edge to volume, it appears out gassing of water and other volatiles is accommodated and has less of an impact in these relatively small samples as compared to PCBs or larger reliability test coupons.
Most often, the failure occurs during the isotherm. It has been observed that samples tend to shrink before failing. This observation would be consistant with an epoxy that was continuing to cross link, building internal stresses until the material fails.
The results of these tests demonstrate that preconditioning some materials can significantly reduce time to delamination while other materials are unaffected. The most surprising finding is that cT260 protocol identifies material degradation but does not necessarily predict delamination in reliability test coupons tested by thermal cycling. Frequently, material samples that failed in less than 10 minutes would produce reduced reliability cycles to failure, but the failure mode was barrel cracks and interconnect failures – not delamination! This counter intuitive relation between time to delamination results and reliability failures has been observed repeatedly over the past five years.
Usually, reliability test coupons will fail and microscopic examination will reveal an understandable cause for the failure. Most often, thin electrolytic or poorly applied electroless copper, poor copper distribution or columnar copper crystals in the PTH will account for the failure. Interconnect problems may relate to drilling or hole preparation that is easily observable in microscopic evaluation. On occasion, microscopic evaluation presents a perfectly fabricated PTH with adequate copper and hole preparation and no observable defects. Frequently, when objective reliability data demonstrates a compromised PCB with no discernable fabrication problems, a cT260 evaluation (FIGURE 1) of a sample taken before testing will degrade in less than 10 minutes. It appears materials that degrade in less then 10 minutes produce reliability coupons that fail in only a few thermal cycles.
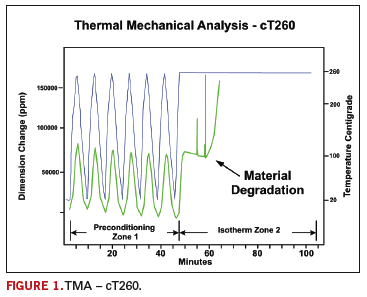
The implications of this test method and its application in reliability testing are still under investigation. One (expressed in changes in Young’s and loss moduli) is not observable in microscopic evaluations, but it has an effect in changing how stress is distributed within the PCB during thermal excursions. The cT260 may be serendipitously reflecting the effect of chemical changes that are expressed in changes in physical attributes that affect thermal cycles to failure. For this reason, the new test method is called time to degradation rather than time to delamination. It is likely that the failures observed in cT260 are a reflection of a cohesive failure rather than a physical adhesive delamination. The term “delamination” in the original test T260 method may be a misnomer when testing today’s high reliability materials.
DELAM Testing
A new method currently under evaluation determines the presence of material delamination in reliability test coupons. The method relies on specifically designed capacitance circuits that are sensitive to changes within the coupon’s dielectric construction. The test vehicle utilizes copper planes, at appropriate layers, across which capacitance is measured. There are a number of different measuring protocols using this technique, but the standard testing philosophy requires initial measurements that are compared to measurements after thermal excursions. In the most common application of this method, capacitance is measured before testing, after preconditioning and at the end of reliability testing. A 4% to 6% drop in capacitance suggests significant material degradation. Usually, adhesive delamination or cohesive failures are found to be the cause of the observed capacitance change. The second most common cause for capacitance change is moisture absorption or loss. Occasionally, changes associated with under curing of the b-stage are observed. This new test method has been given the acronym DELAM: Dielectric Estimation and Laminate Analysis Method.
There are eight common factors that affect capacitance measurements in PCB test coupons. The first three establish the coupon’s initial capacitance and include the dielectric material, coupon design and PCB construction. Base materials present a dielectric constant (Dk), the circuit design determines the surface area of the copper planes and the coupon construction establishes the distance between the planes. There are five variables that may cause a change in capacitance readings, including the presence or lack of moisture in the dielectric, changes in the distance between copper planes due to plastic deformation of the dielectric, changes in the Dk due to curing or material degradation and propagation of cracks (delamination) in the dielectric between each pair of planes. This method provides a tool to find adhesive delamination, cohesive failure of the epoxy, crazing, material decomposition and the presence or lack of moisture in the dielectric (either absorbed epoxy or as a liquid in crevasses).
There are two commonly used applications for this method: evaluating coupons for material changes like delamination, crazing or decomposition, and establishing a construction profile that allows an ability to identify and compare coupons with variations in construction.
Construction Profile
One useful application of the DELAM method is the ability to compare the construction for each production panel within a lot. This may be extended to compare production lots or panels fabricated by different vendors. Errors in PCB lay-up are easily observed by measuring the capacitance between layers in the coupons and plotting the coupons construction profiles. If the construction has a different dielectric build or if the coupon is laid up with mixed materials or has reversed layers, a different construction profile will be observed. This comparison test, based on capacitance measurements, has great utility in demonstrating variations between coupons.
FIGURE 2 demonstrates two different 6-layer constructions. The capacitances in picofarads (pF) are measured for each layer in both coupons and then plotted, demonstrating how the two boards will present different construction profiles. If many construction profiles are plotted together, coupons with different constructions are readily identified.
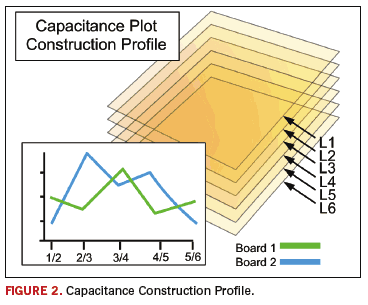
FIGURE 3 identifies the possibility of incorrect dielectric thickness at layer 6/9 in coupon A1. Since the capacitance is higher, one might expect a missing sheet of “B-stage” material. If the layers were laid up out of order, one would also expect a change in capacitance profile. Whatever the cause, changes in the capacitance profile identifies a problem in construction that requires investigation.
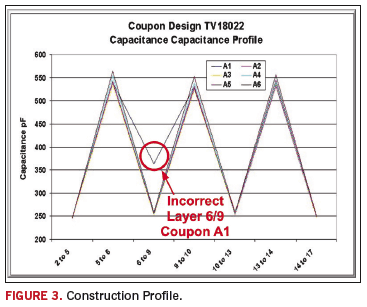
If all the coupons were laid up incorrectly, but in the same manor, there would be no practicle method of determining the error. It is conceivable that dielectric spacing, surface area of the plane and Dk of each material in the stack up could be used to calculate the expected capacitance and to compare those results to measured values. The practical approach is to establish a capacitance profile on a “golden board” and use that to compare to subsequent lot profiles.
DELAM Testing
The most useful application of this method is testing to identify the presence of delamination and other types of material degradation. Coupons subjected to reliability and DELAM evaluation will reflect damage to conductors and base materials. In FIGURE 4 capacitance is measure on a coupon “as received” (green line) and after preconditioning (blue line). Delamination between layers 3/4 causes a reduction in capacitance. The “as received” capacitance profile is plotted and compared to the coupon after preconditioning. The presence and location of delamination is obvious in “before” and “after” capacitance plots.
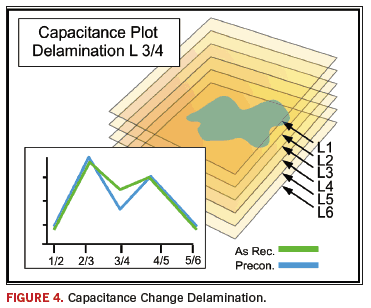
TABLE 2 is the capacitances, in picofarads, of the layer 4/5 dielectric in a 10-layer coupon. Capacitance measurements were taken before testing (green), after preconditioning 4X260°C or 6X260°C (yellow) and at the end of test 150°C for 500 cycles (orange). The coupons were subjected to lead-free preconditioning with four or six thermal excursions to 260°C to simulate four assembly and two rework cycles. The coupons did not violate the 4% degradation as results of either level of preconditioning, although the coupons exposed to six thermal excursions had 2% or greater change. All coupons showed delamination by the end of the test. This data suggests that lead-free assembly degraded the material enough to fail during test to 150°C.
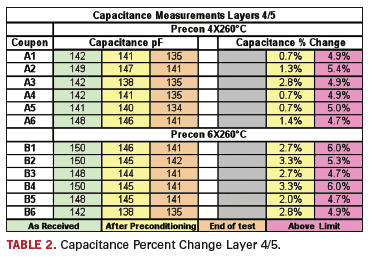
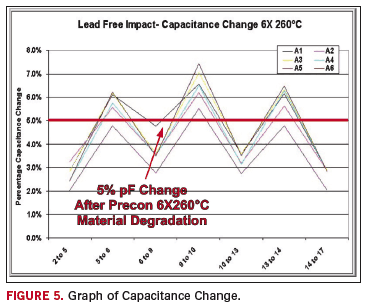
FIGURE 5 shows changes in capacitance above a threshold set to 5%. The sensitivity of the coupon design, coupled with the construction implemented by the fabricator, produced a coupon that was more sensitive to changes in capacitance than other design/construction combinations. Using microsections as the referee, the capacitance threshold was increase from 4% to 5% for this application. The data (FIGURE 6) shows that after six thermal excursions to 260°C to simulate lead-free assembly and rework layers 5/6, 9/10 and 13/14 were prone to delamination which was confirmed by microscopic evaluation (FIGURE 7).
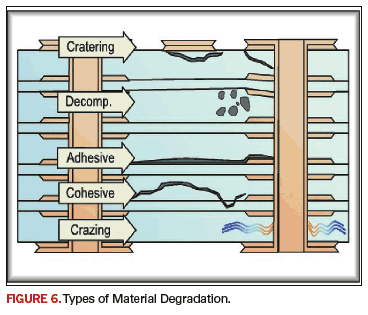
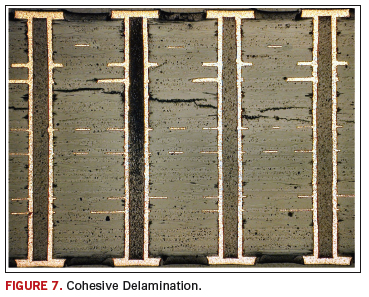
The types of material degradation that have been identified with capacitance measurements include adhesive delamination, cohesive failure, crazing and material decomposition. It should be noted that in lead-free applications, lifted pads and cratering are also observed, but these material conditions are not found with DELAM methodology.
The leading edge of capacitance testing is to define, or at least to establish, the effect of thermal excursions on capacitance during a thermal ramp. Initial studies suggest that CTE and Tg may be directly measured, or possibly inferred, by recording capacitance during the thermal cycle. It may be possible to observe changes in Tg, CTE and Dk by measuring capacitance during thermal excursions. This method may be able to demonstrate moisture loss, changes in Dk due to curing or material degradation, as well as define the onset of delamination. The data could then be compared to reliability measurements and failure modes to produce a comprehensive tool to analyze dielectric materials and determine their role in PCB reliability.
Both of these methods, cT260 and DELAM, have been implemented in standard testing protocol by a number of companies. These methods offer two powerful tools in understanding how circuit boards fail, the role of material in PCB reliability and the consequences of process changes like lead-free assembly. These methods are now being requested as part of reliability testing and as stand-alone tests to investigate specific areas of concern in specific applications. PCD&F
Paul Reid the program coordinator at PWB Interconnect Solutions, in Ottawa, Ontario, Canada and can be reached at This email address is being protected from spambots. You need JavaScript enabled to view it..


